Figures & data
Figure 1. PDK1 influences PD-L1 expression in ovarian cancer. (a–c) Knockdown efficiency of PDK1 assessed via qPCR and immunoblotting in A2780CP and SKOV-3 cells (a). PD-L1 expression in A2780CP and SKOV-3 cells after knockdown of PDK1 evaluated via immunoblotting (a), qPCR (b) and flow cytometry (c). (d–f) Overexpression of PDK1 in OVCAR3 cells assessed via qPCR and immunoblotting (d). PD-L1 expression in OVCAR3 cells overexpressing PDK1 detected via immunoblotting (d), qPCR (e) and flow cytometry (f). (g) Representative immunohistochemistry samples showing similar expression patterns of PDK1 and PD-L1 within ovarian cancer. (h) Statistical analysis showing a positive correlation between PDK1 and PD-L1 in an ovarian cancer tissue array. Representative data from three experiments are shown (*P < .05, **P < .01, ***P < .001, ****P < .0001).
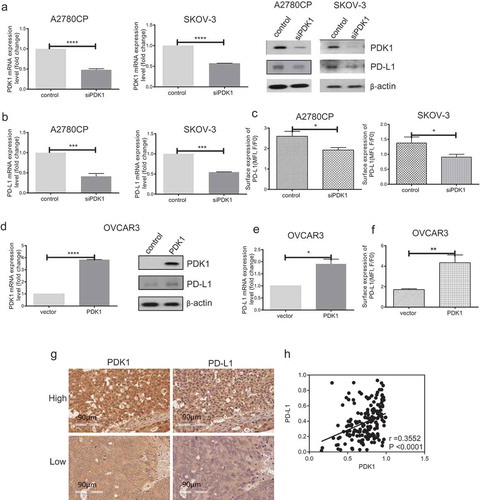
Figure 2. PDK1 expressed in ovarian cancer cells impairs CD8+ T cell function through PD-L1 regulation. CD8+ T cells collected from the co-culture system were stained with antibodies against CD8A and IFN-γ. (a, c) Flow cytometry analyses showing IFN-γ secretion by CD8+ T cells co-cultured with A2780CP cells depleted of PDK1 or control cells (a), OVCAR3 cells overexpressing PDK1 or control cells (c). (b, d) Statistical analysis of IFN-γ detected via flow cytometry. (e) IFN-γ secretion by CD8+ T cells co-cultured with OVCAR3 cells with PDK1 overexpression in the presence of anti-PD-L1. (f) Statistical analysis of . Representative data from three experiments are shown (*P < .05, ***P < .001).
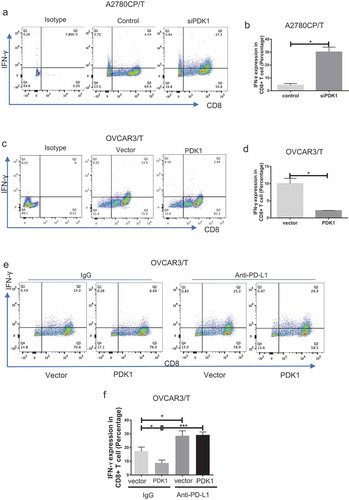
Figure 3. PDK1 expressed in ascites-derived ovarian cancer cells impairs CD8+ T cell function. (a) PD-L1 mRNA expression in paired primary ovarian cancer and ascites-derived ovarian cancer cells. (b) Representative results of flow cytometry showing PD-L1 surface expression in primary ovarian cancer and ascites-derived cancer cells. c-e Transient knockdown of PDK1 mRNA and protein expression (c) in representative cases of ascites-derived ovarian cancer cells. PD-L1 protein (c), mRNA (d) and surface expression (e) in representative cases of ascites-derived ovarian cancer cells with knockdown of PDK1. (f) Representative results showing IFN-γ secreted by CD8+ T cells co-cultured with ascites-derived ovarian cancer cells depleted of PDK1 or control cells. g Statistical analysis of (n = 8) (*P < .05, ***P < .001, **** P < .0001).
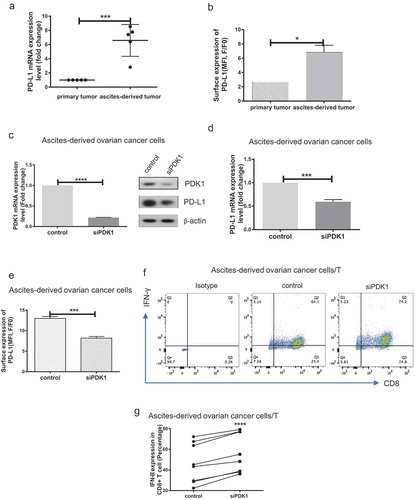
Figure 4. PDK1 expressed in ovarian cancer cells promotes CD8+ T cell apoptosis through PD-L1. (a) Apoptosis rates of CD8+ T cells co-cultured with A2780CP cells with PDK1 knockdown or control cells. (b) Apoptosis rates of CD8+ T cells co-cultured with OVCAR3 cells overexpressing PDK1 or control cells in the presence of anti-PD-L1 or control IgG. Representative data from three experiments are shown (*P < .05 **P < .01).
Figure 5. JNK-c-Jun activation is involved in PDK1-induced PD-L1 expression in ovarian cancer cells. (a) Immunoblotting of total and phosphorylated forms of JNK and c-Jun in OVCAR3 cells overexpressing PDK1 and SKOV-3 cells depleted of PDK1. (b, c) PD-L1 mRNA and surface expression in PDK1-overexpressing OVCAR3 cells with knockdown of JNK1. (d) PDK1 mRNA expression in OVCAR3 cells transfected with PDK1-expressing plasmid followed by siRNAs targeting JNK1. (e) qPCR assessment of JNK1 mRNA expression. Representative data from three experiments are shown (*P < .05, **P < .01, ****P < .0001).
Figure 6. Co-treatment with the PDK inhibitor, DCA, and anti-PD-L1 antibody suppresses tumor growth in an ID8 ovarian cancer model. (a). Typical presentation of ID8 ovarian cancer tumors in C57BL/6 mice treated with DCA and/or anti-PD-L1 antibody. (b). Scheme of the therapeutic strategy. (c). Overall survival of mice from the four groups. (d). Peritoneal tumors were counted and weighed following euthanization. Each dot represents a single mouse (* P < .05, ** P < .01).
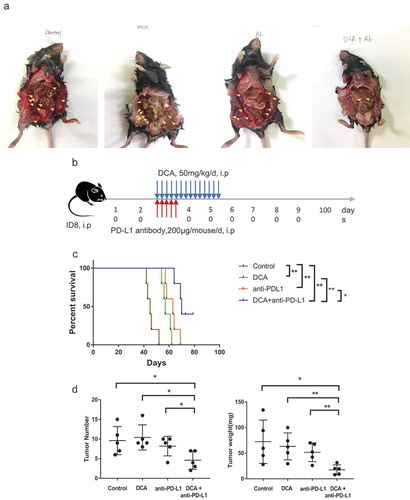
Figure 7. Combination of DCA with anti-PD-L1 antibody promotes IFN-γ secretion of monocytes isolated from tumors. a. Representative results of IFN-γ-positive monocytes. b. Statistical analysis of IFN-γ-positive monocytes in tumors from the four groups. (* P < .05, ** P < .01).
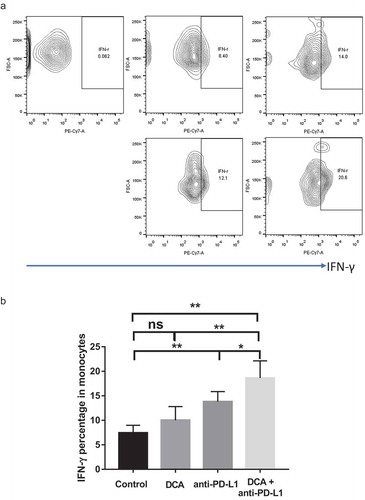
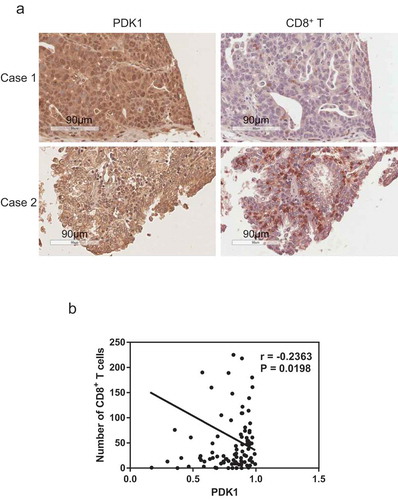
Figure 8. Expression of PDK1 in ovarian cancer is negatively correlated with CD8+ T cell infiltration. (a) Representative immunohistochemical staining image of PDK1 (left panel) and CD8+ T cells (right panel) in ovarian cancer tissue. (b) Spearman’s rho analysis of PDK1 staining density in relation to the number of CD8+ T cells in ovarian cancer. PDK1 staining density was calculated using Image Scope software and CD8+ T cell numbers counted manually.