
Figures & data
Figure 1. Retargeting of UniCAR T cells with the novel PET tracer-based PSMA PLT-TM. (a) In previous studies, we showed that UniCAR T cells can be retargeted to tumor cells via single-chain fragment variable (scFv)-based target modules (TMs). As schematically shown such scFv-based TMs represent a fusion molecule consisting of the respective scFv and the UniCAR epitope (E5B9). Thus, UniCAR T cells can form an immune complex with the TM, which allows the UniCAR T cell to recognize a specific target on the surface of the tumor cells. (b) As the development of a scFv-based TM for a clinical application is time-consuming and cost-extensive, we wanted to learn whether or not functional TMs can also be constructed from low-molecular-weight molecules: E.g. based on the PSMA-specific ligand PSMA-HBED-CC (PSMA-11 analogue). In order to transform this tracer in a potential TM, we fused the E5B9 epitope during chemical synthesis with PSMA-HBED-CC (see also ). The resulting compound PSMA peptide/ligand tracer TM (PSMA PLT-TM) cannot only be used for PSMA-PET imaging but also for retargeting of UniCAR T cells to PSMA-positive tumor cells.
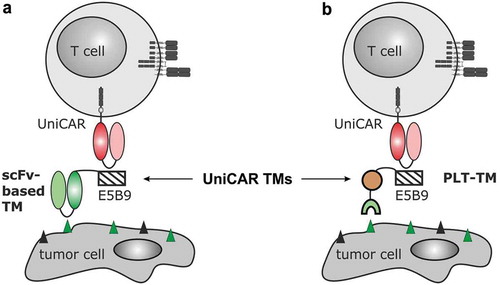
Figure 2. Synthesis of PSMA PLT-TM. The (tBu protected) PSMA-binding motif and a PEG linker were coupled to either side of the Fe-protected HBED-CC double TFP ester (1) to give (2). The synthesis of the C-terminally modified E5B9 peptide (SKPLPEVTDEY-Propargylglycine) (3) was performed manually on a 2CT-Resin under application of standard Fmoc-protocols and cleaved from it with a mixture of TFA/TIPS/H2O (95/2.5/2.5, v/v/v). Then, (2) and (3) reacted via the Cu(I)-catalyzed alkyne-azide cycloaddition (CuAAC), the final product was isolated and the tBu groups were deprotected with TFA. Then, Fe was removed from the complex by applying 1 M HCl on a C-18 SEP-PAK cartridge. The final product was eluted from the cartridge with a mixture of CH3CN/water (7/3, v/v, 20 mL).
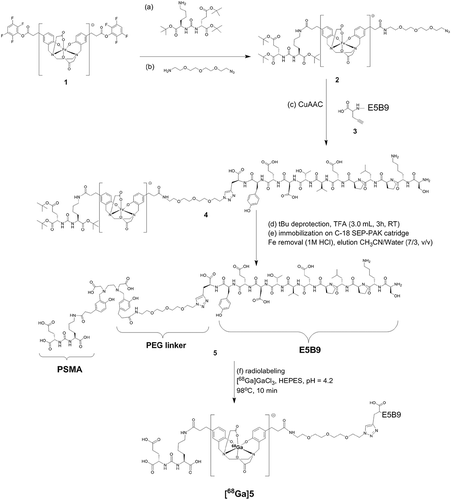
Figure 3. Binding analysis of PSMA PLT-TM. (a) Displacement curves of 68Ga-PSMA-10 (30 nM) bound to PSMA expressed on LNCaP cells (105 cells per well). Results are expressed as % specific cell-bound radioactivity after incubation (45 min, RT) with increasing concentrations of non-radiolabeled PSMA-PLT TM or PSMA-11. The IC50 values are expressed as mean ± SD. Experiments were performed in quintuplicate. (b) 2 × 10⁵ LNCaP or PC3 cells were incubated with 20 ng/µL TM. Binding was detected using the mouse anti-E5B9 and PE-labeled goat anti-mouse IgG Abs. In addition, cells were stained with mouse anti-human PSMA Ab/PE as positive control. Histograms show stained cells (blue line) and respective negative controls (black line). Percentage indicate proportion of PSMA+ cells under the marker. (c) For comparison of the binding affinity of the novel PSMA PLT-TM with the scFv-based αPSMA scFv-TM increasing amounts of the respective TM were incubated with LNCaP cells. The binding was estimated by flow cytometry. Relative median of fluorescence intensity (MFI) values were plotted against the concentration. Mean ± SEM of two different experiments is shown. KD values were calculated from the binding curves.
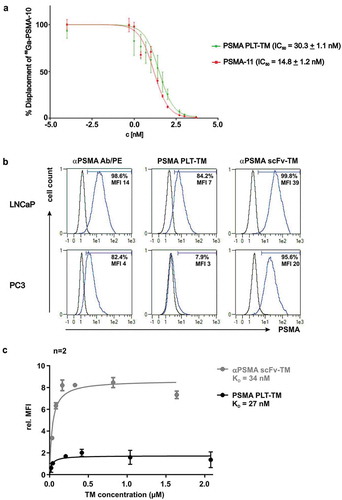
Figure 4. Killing capability of PSMA PLT-TM redirected UniCAR T cells. (a–d) In order to compare the killing capability of UniCAR T cells (UniCAR 28/ζ) armed with either the PSMA PLT-TM or the αPSMA scFv-TM, chromium release assays were performed using either PSMA-positive (a, c) LNCaP or (b, d) PC3 tumor cells. (a, b) As negative controls served UniCAR T cells transduced with an EGFP-expressing vector control (vector control) or UniCAR construct lacking the signaling domains (UniCAR Stop). Data are reported as mean ± SEM for three independent donors. (***p < .0002, **p < .002, *p < .033 with respect to UniCAR 28/ζ w/o TM; 2way ANOVA with Tukey’s multiple comparisons test). (c, d) In order to estimate the range of working concentration for the PSMA PLT-TM PSMA-positive (c) LNCaP cells or (d) PC3 cells were co-cultivated with human T cells modified with the UniCAR signaling construct at an E:T ratio of 5:1. The TM was added at indicated concentrations. Specific lysis of tumor cells was estimated by chromium release assays (see Materials and methods). Data are reported as mean ± SEM for indicated number of independent donors. (***p < .0002, **p < .002 with respect to UniCAR 28/ζ w/o TM; 2way ANOVA with Sidak’s multiple comparisons test). (e) PSMA-positive PC3 cells were incubated with UniCAR T cells in the presence (w/TM) or absence (w/o TM) of the PSMA PLT-TM. Images were taken at the start (10 min), after 60 min, 120 min, 180 min, and 210 min.
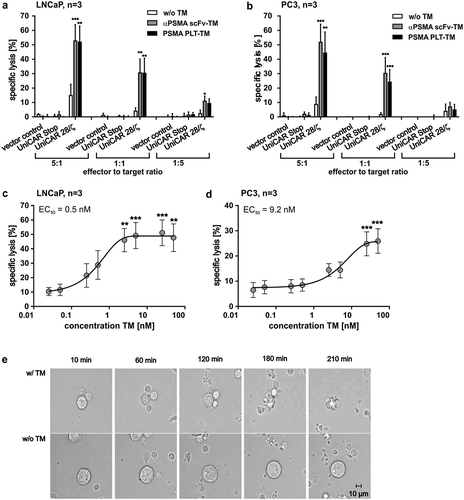
Figure 5. Analysis of cytokine release from redirected UniCAR T cells. Genetically engineered T cells (vector control, UniCAR Stop or UniCAR 28/ζ) were cultivated with or without PC3 cells (E:T = 5:1), either in the presence or in the absence of scFv-based αPSMA scFv-TM or PSMA PLT-TM. Data show concentrations of selected cytokines after 24 h and are reported as mean ± SD for four independent donors. (***p < .0002, **p < .002 with respect to UniCAR 28/ζ + tumor cells w/o TM; 2way ANOVA with Tukey’s multiple comparisons test).
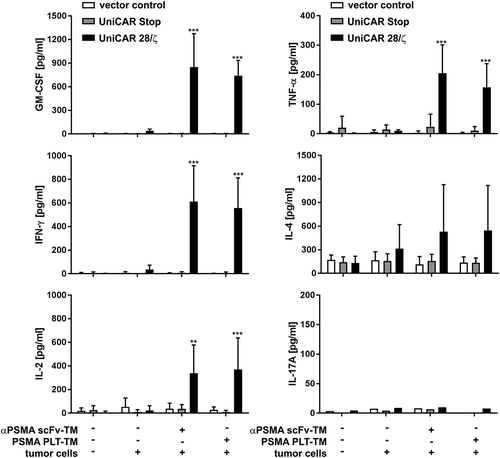
Figure 6. Retargeting of UniCAR T cells armed with the PSMA PLT-TM in experimental mice. 1 × 10⁶ LNCaP-Luc tumor cells were mixed with 0.5 × 10⁶ UniCAR 28/ζ T cells and 300 pmol/100 µL of the PSMA PLT-TM (LNCaP-Luc + UniCAR T cells + PSMA PLT-TM) per mouse. As “untreated” controls served either 1 × 10⁶ LNCaP-Luc cells alone (LNCaP-Luc cells) or tumor cells were mixed with 0.5 × 10⁶ UniCAR 28/ζ T cells without any TM (LNCaP-Luc + UniCAR T cells). The respective mixture (100 µL) was injected subcutaneously into female NMRI nu/nu mice resulting in three groups of animals each consisting of five mice. Luminescence imaging of anesthetized mice was performed 10 min after i.p. injection of 200 µL of luciferin (15 mg/mL) starting at day zero (day 0) and followed at day two (day 2).
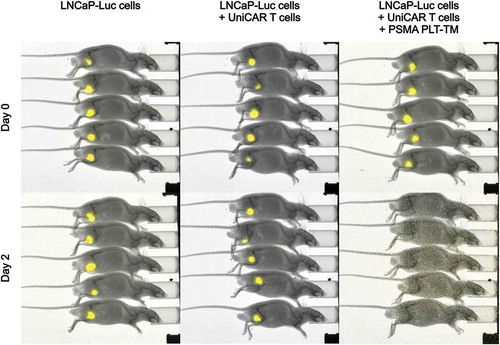
Table 1. Biodistribution of [68Ga]Ga-PSMA PLT-TM. The biodistribution of [68Ga]Ga-PSMA PLT-TM and of [68Ga]Ga-PSMA-11 was determined for three mice inoculated with LNCaP tumors, injected with approximately 10 MBq radiotracer and low (high molar activity) and high (low molar activity) amounts of PSMA PLT-TM. Values are provided as SUV (g/g). BW: body weight; BAT: brown adipose tissue; PSMA PLT-TM: PSMA peptide/ligand tracer target module; WAT: white adipose tissue; Subm.gl.: submandibular glands.
Figure 7. (a) PET imaging of the novel [68Ga]Ga-PSMA PLT-TM is shown as maximum intensity projections (MIP) and orthogonal planes (axial, coronal, sagittal) of two LNCaP tumor-bearing NMRI nu/nu mice. The distribution kinetics of [68Ga]Ga-PSMA PLT-TM (injected activity 15 MBq, molar activity 18 GBq/µmol, injected peptide amount 0.52 nmol PSMA PLT-TM) after single intravenous injection was measured in a dynamic PET study over 2 h and the images were prepared as integral activity from 60 to 120 min (midframe time 90 min). To demonstrate the specific binding of [68Ga]Ga-PSMA PLT-TM, PSMA was competitively blocked by simultaneous injection of 86 nmol/animal unlabeled PSMA PLT-TM in one animal (blocked). The green arrows show the tumor of the control animal (SUVmax 1.6 g/mL) and the red arrows indicate blocked tumors (SUVmax 0.06 g/mL). The color scales are in SUV (SUV, 0–1.6) and Hounsfield Units (HU, −1000–9093). (b) Blocking of [68Ga]Ga-PSMA PLT-TM tumor uptake. Estimation of (Bi) the blood and tumor uptake kinetics and (Bii) the corresponding tumor/blood and tumor/muscle ratios in the absence (control) or presence (blocked) of 86 nmol of unlabeled PSMA PLT-TM. Plots show mean ± SEM from experiments of four mice. (c) Kinetics of [68Ga]Ga-PSMA PLT-TM tumor uptake and blood activity concentration (SUVmean). Comparison of [68Ga]Ga-PSMA PLT-TM in LNCaP tumor-bearing mice without (control, n = 4) or with simultaneous injection of 86 nmol of non-radiolabeled PSMA PLT-TM (TM simultaneous, n = 4) and 50 min after radiotracer injection, injection of 2 µmol 2-PMPA (50 min p.i. PMPA, n = 2). The activity concentrations were derived from the ROIs over the tumors. Plots are presented as mean ± SEM of n experiments, respectively. (d) PET imaging of a patient with metastasized PCa comparing [68Ga]Ga-PSMA PLT-TM with [68Ga]Ga-PSMA-11. (Di) [68Ga]Ga-PSMA-11 was used for PET of a patient with metastasized PCa. (Dii) The same patient has undergone PET imaging 2 weeks later using [68Ga]Ga-PSMA PLT-TM. (Diii) PET scan of a healthy volunteer using [68Ga]Ga-PSMA PLT-TM.
![Figure 7. (a) PET imaging of the novel [68Ga]Ga-PSMA PLT-TM is shown as maximum intensity projections (MIP) and orthogonal planes (axial, coronal, sagittal) of two LNCaP tumor-bearing NMRI nu/nu mice. The distribution kinetics of [68Ga]Ga-PSMA PLT-TM (injected activity 15 MBq, molar activity 18 GBq/µmol, injected peptide amount 0.52 nmol PSMA PLT-TM) after single intravenous injection was measured in a dynamic PET study over 2 h and the images were prepared as integral activity from 60 to 120 min (midframe time 90 min). To demonstrate the specific binding of [68Ga]Ga-PSMA PLT-TM, PSMA was competitively blocked by simultaneous injection of 86 nmol/animal unlabeled PSMA PLT-TM in one animal (blocked). The green arrows show the tumor of the control animal (SUVmax 1.6 g/mL) and the red arrows indicate blocked tumors (SUVmax 0.06 g/mL). The color scales are in SUV (SUV, 0–1.6) and Hounsfield Units (HU, −1000–9093). (b) Blocking of [68Ga]Ga-PSMA PLT-TM tumor uptake. Estimation of (Bi) the blood and tumor uptake kinetics and (Bii) the corresponding tumor/blood and tumor/muscle ratios in the absence (control) or presence (blocked) of 86 nmol of unlabeled PSMA PLT-TM. Plots show mean ± SEM from experiments of four mice. (c) Kinetics of [68Ga]Ga-PSMA PLT-TM tumor uptake and blood activity concentration (SUVmean). Comparison of [68Ga]Ga-PSMA PLT-TM in LNCaP tumor-bearing mice without (control, n = 4) or with simultaneous injection of 86 nmol of non-radiolabeled PSMA PLT-TM (TM simultaneous, n = 4) and 50 min after radiotracer injection, injection of 2 µmol 2-PMPA (50 min p.i. PMPA, n = 2). The activity concentrations were derived from the ROIs over the tumors. Plots are presented as mean ± SEM of n experiments, respectively. (d) PET imaging of a patient with metastasized PCa comparing [68Ga]Ga-PSMA PLT-TM with [68Ga]Ga-PSMA-11. (Di) [68Ga]Ga-PSMA-11 was used for PET of a patient with metastasized PCa. (Dii) The same patient has undergone PET imaging 2 weeks later using [68Ga]Ga-PSMA PLT-TM. (Diii) PET scan of a healthy volunteer using [68Ga]Ga-PSMA PLT-TM.](/cms/asset/102e84d7-fc47-4268-a5a9-84558b43bca1/koni_a_1659095_f0007_oc.jpg)