Figures & data
Figure 1. Human and murine macrophages express BTK and the NLRP3 inflammasome. (a) Immunoblot for BTK, NLRP3, ASC, and beta-actin (control) expression in TAM generated in vitro. (b) Immunoblot for BTK, NLRP3, ASC, and beta-actin expression in bone marrow-derived macrophages (c) Immunoblot for BTK, NLRP3, ASC, and beta- actin expression in the murine macrophage cell line RAW 264.7. Results are representative of three separate immunoblots in A- C and each lane represents a separate aliquot of cells. (d) Immunofluorescence staining of BTK and CD163 (macrophage marker) in EMT6 murine and human breast tumors. Human breast tumor is from a patient with invasive lobular carcinoma that was positive for estrogen and progesterone receptors and negative for HER 2/neu.
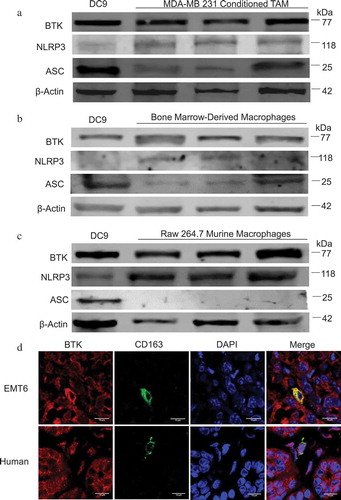
Figure 2. BTK is phosphorylated following NLRP3 inflammasome activation and its phosphorylation is inhibited with ibrutinib. (a) Confocal images show in vitro generated TAM stained for p-BTK (green). DAPI nuclear staining appears blue. TAM generated in vitro were pre- treated with either DMSO (control) or ibrutinib (1 µM) for 30 minutes and then stimulated with LPS (50 ng/mL) for 3 hours and ATP (2 mM) for 1 hour. Cells were viewed in 60X and 20X and repeated experimentally three times (b) Immunoblot showing p-BTK and beta-actin (control) expression in TAM generated in vitro and stimulated with LPS and ATP following treatment with either DMSO or ibrutinib (1 µM). Results are representative of three separate immunoblots and quantified in the bar graph. (c) Mean fluorescence intensity of p-BTK (Tyr 223) in TAM generated in vitro treated with DMSO or ibrutinib and stimulated with LPS and then ATP. The results are representative of three separate experiments and quantified in the bar graph. Values are displayed as means ± SE from three independent experiments. Statistical differences between treatment groups were determined using a Student’s t-test, p < .05.
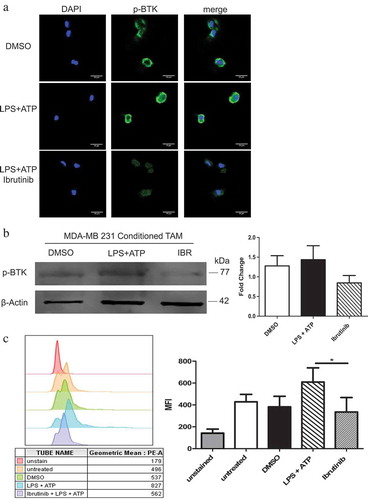
Figure 3. BTK inhibition impairs NLRP3 inflammasome activity. In vitro generated tumor-associated macrophages (TAM) were untreated or treated with either DMSO or ibrutinib (1 μM) for 30 minutes followed by stimulation with LPS (50 ng/mL) for 3 hours and ATP (2 mM) for 1 hour and IL-1β release was analyzed following treatment and stimulation by (a) ELISA and (b) qRT-PCR. Values are displayed as means ± SE from three independent experiments. (c) Immunoblot analysis of pro-IL-1β, pro-caspase-1, and beta-actin (control) expression in TAM generated in vitro (c) and RAW 264.7 cells (d). Cells were treated with either DMSO or ibrutinib (IBR) for 30 minutes followed by stimulation with LPS (50 ng/mL) for 3 hours and ATP (2 mM) for 1 hour. Cells were harvested immediately after ATP. Results are representative of three separate immunoblots and are quantified in the bar graphs as a fold change relative to beta- actin. (e) Cell supernatants from in vitro generated TAM pretreated with either DMSO or ibrutinib followed by stimulation with LPS and ATP were subjected to immunoblot for cleaved IL- 1β and cleaved caspase-1. Results are representative of three separate immunoblots and are quantified in the bar graphs as a fold change relative to DMSO. Statistical differences between treatment groups were determined using a Student’s t-test, * p < .05, ** p < .01, *** p < .001.
Figure 4. BTK physically interacts with the NLRP3 inflammasome in tumor-associated macrophages generated in vitro. (a) Immunoblots depicting an immunoprecipitation experiment using in vitro generated TAM treated with either DMSO or ibrutinib (IBR) for 30 minutes followed by stimulation with LPS (50 ng/mL) for 3 hours and ATP (2 mM) for 1 hour. Cells were harvested immediately after ATP. Cell lysates were immunoprecipitated for BTK followed by probing for ASC. Results are representative of three separate immunoblots. (b) In vitro generated TAM treated and stimulated as in (a). Cells were stained for BTK (red) and either NLRP3, ASC, or IL-6 control (green) to show co-localization (yellow). DAPI nuclear staining shows as blue. Cells were viewed in 60X and 20X and repeated experimentally three times. Immunofluorescence staining was quantified in the bar graphs and is expressed as arbitrary unit (AU). Values are displayed as means ± SE from 50 cells per group cells. Statistical differences between treatment groups were determined using a Student’s t-test, ***p < .001.
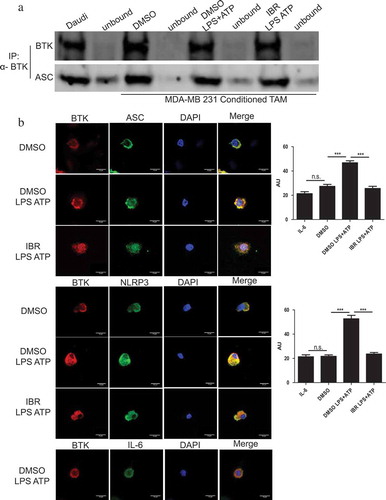
Figure 5. BTK inhibition reduces NLRP3 inflammasome activity in vivo. Female BALB/c mice were injected with (a) EMT6 or (b) 4T1 cells in the mammary fat pad to produce tumors. n = 8 mice per tumor model. Ibrutinib or vehicle was administered by drinking water at 25 mg/kg daily for 10 days. Tumors were harvested and stained for IL-1β, NLRP3, and IL-6 via immunohistochemistry. Ibrutinib treated mice showed reduced amounts of staining (indicated by red arrow) for IL-1β and NLRP3. IL-6 was used as a control with the expectation that it does not associate with the inflammasome and that its levels should not be affected by BTK inhibition. (c) Immunofluorescence staining of CD163 (marker of macrophages) and IL-1β in EMT6 murine and human breast tumors. Human breast tumor is from a patient with invasive lobular carcinoma that was positive for estrogen and progesterone receptors and negative for HER 2/neu.
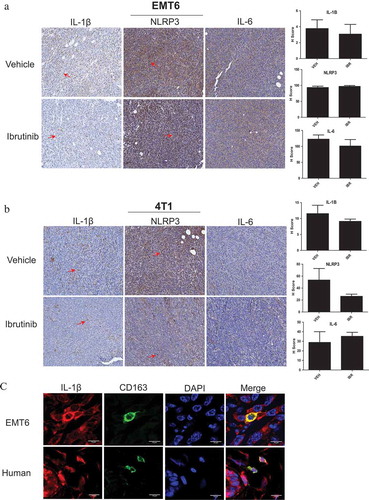
Figure 6. Ibrutinib is not cytotoxic. Tumor cells do not express BTK diminishing the likelihood that ibrutinib exerts a direct anti-tumor effect. (a) 5 × 10⁵ MDA- MB 231- conditioned TAM, RAW 264.7, MDA-MB 231, and EMT6 cells were treated with DMSO or ibrutinib (1μM) for 4 hours. After 4 hours cells were mixed with 1-part 0.4% trypan blue to 1-part cell suspension. Viable and nonviable cells were counted. Values represent mean ± SE. This figure is a compilation of three independent experiments. Immunoblot for BTK and beta-actin (control) of (b) MDA-MB 231 and (c) EMT6 cells showing a lack of BTK expression. DC9 cells were used as a positive control.