
Figures & data
Figure 1. Design and characterization of the AdCAR-T system
A) Schematic illustration of a conventional CAR (left panel) and the AdCAR-T system (right panel). B-C) AdCAR-T activation translates into specific cytokine production and target-cell lysis. AdCAR-T were incubated with the CD19+ ALL cell line NALM6 at an E:T ratio of 1:1 with or without 10 ng/mL of CD19 mAb (without LLE-tag), LLE-CD19 mAb or LLE-GD2 mAb. Cytokine levels in the supernatant were determined after 12 h (n = 3, p < .0001 for TNFα and IFNγ). Target-cell lysis after 24 h was determined by luciferase-based cytotoxicity assay (LCA). C-D lower panel) Schematic illustration of AdCAR-T specificity, eliminating CD19+ NALM6 or GD2+ LS target cells exclusively in the presence of the LLE-CD19 or LLE-GD2 mAb, respectively. D) AdCAR-T were incubated with the GD2+ neuroblastoma cell line LS at an E:T ratio of 1:1 with or without 10 ng/mL GD2 mAb (without LLE-tag), LLE-GD2 mAb or LLE-CD19 mAb. Target-cell lysis was determined by xCELLigence an impedance-based real-time cytotoxicity assay (ICA), that provides a real-time analysis (n = 3, p < .0001). Data shown in B) represent mean ± SEM of 3 independent experiments from 3 different donors. Data shown in C–D) represent mean ± SEM of (n = 4) independent experiments in triplicates from 4 different donors. In B–D) significance was determined by one-way ANOVA and Tukey post hoc test. (n.s.) not significant.
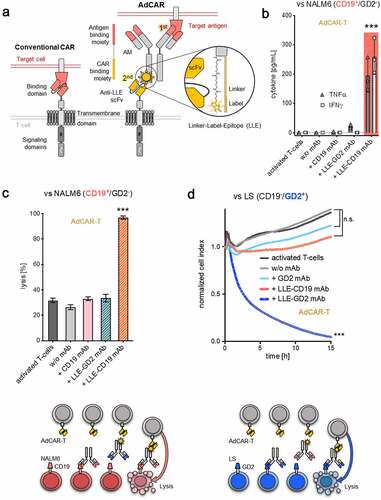
Figure 2. Specificity and sensitivity of the AdCAR-T system
A) AdCAR-T were incubated for 24 h with NALM6 at an E:T ratio of 1:1 in the presence of 10 ng/mL LLE-CD19 mAb and indicated concentrations of free biotin or human serum. Target-cell lysis was determined by LCA. Comparison of conditions without LLE-CD19 mAb was not significant. Comparison of conditions with LLE-CD19 mAb was not significant. Conditions without versus with LLE-CD19 mAb were highly significant (n = 4, p < .0001). B) AdCAR-T or non-transduced activated T cells with or without 10 ng/mL LLE-CD19 mAb or conventional CD19-CAR-T were incubated with NALM6 at indicated E:T ratios. Target-cell lysis was determined by LCA after 6 h and 12 h (n = 4, p = .0055 at E:T 0.15:1, 12 h). C) AdCAR-T or nontransduced activated T cells with or without 10 ng/mL LLE-GD2 mAb or conventional GD2-CAR-T were incubated with LS at an E:T ratio of 2:1. Target-cell lysis was determined by xCELLigence an impedance-based real-time cytotoxicity assay (ICA), that provides a real-time analysis. Comparison of conditions without LLE-GD2 mAb was not significant. Comparison of AdCAR-T with LLE-GD2 mAb was not significant. Comparison of AdCAR-T without versus with LLE-GD2 mAb was highly significant (n = 4, p < .0001). D) AdCAR-T were incubated with NALM6 at an E:T ratio of 1:1 for 24 h in the presence of LLE-CD19 mAb at indicated concentrations. Target-cell lysis was determined by LCA. Titration curve is shown. EC50 = 7.9 pg/mL. E) AdCAR-T were incubated with NALM6 at an E:T ratio of 1:1 for 24 h at 1 ng/mL LLE-CD19 mAb and indicated concentrations of CD19 mAb (without LLE-tag). Target-cell lysis was determined LCA (upper panel). Concentrations of LLE-CD19 mAb and CD19 mAb are schematically illustrated (lower panel). Data shown in A–C) and E) represent mean ± SEM of four independent experiments in triplicates from four different donors. Data shown in D) represent mean ± SEM of (n = 5) independent experiments in triplicates from different donors. In A) and C) significance was determined by one-way ANOVA and Tukey post hoc test, in B) by unpaired, two-tailed Mann-Whitney test. (n.s.) not significant.
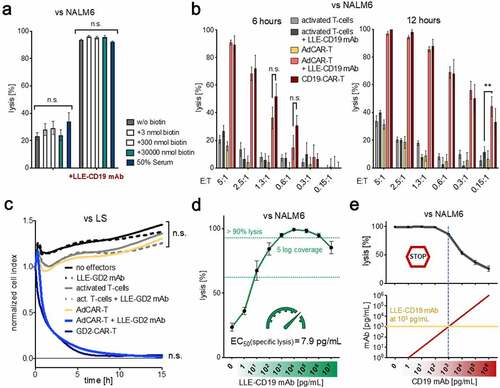
Figure 3. In vivo evaluation of AdCAR-T
A) First we tested the stability and functionality of the LLE-conjugation to mAb in human whole blood at 37°C for 24 h (). The starting concentration was 1 µg/mL. We added 1 µg of LLE-CD19 mAb to freshly isolated human plasma (10 IU/mL sodium heparin) (n = 12) independent donors in one experiment. The LLE-mAb concentration was measured indirectly as the binding capacity to the cell line NALM6 with a secondary anti-biotin mAb calculated by a standard curve. The analysis revealed stability of the LLE-conjugation.B) Three mice received PBS (w/o LLE-mAb) or either 5 µg of LLE-CD19 mAb intraperitoneally or intravenously. After 24 h, the plasma levels of LLE-CD19 mAb were measured by flow cytometry. The comparison revealed no significant difference in the plasma levels. C) Three mice received PBS (w/o LLE-mAb) or CD19 mAb w/o LLE-conjugation or 5, 25, or 50 µg of LLE-CD19 mAb intraperitoneally. At the time points 7 days and 14 days, the plasma levels of LLE-CD19 mAb were measured by flow cytometry and were detectable after 14 days at relevant concentrations in a nontumor bearing NSG mouse model. D) Schematic illustration of the in vivo experiment: NSG mice were inoculated with the NHL cell line Raji (Raji-fluc)at day −6. At day −1, mice were randomized after in vivo imaging according to BLI activity (Supplementary Figure 3b). LLE-rituximab (50 µg) was injected intraperitoneally twice weekly as indicated, starting on day −1. Application was suspended on day +23. AdCAR-T or CD20-CAR-T were injected intravenously as indicated on day 0. E) Luciferase activity [photons/sec] was determined by in vivo BLI. Representative BL images of the study group, AdCAR-T + LLE-rituximab, and the control groups, AdCAR-T, LLE-rituximab, and CD20-CAR-T are shown. F) Luciferase activity was quantified and plotted over time. Arrowhead indicates the termination of LLE-rituximab application. Comparison of BLI activity at day 44 revealed no difference between the groups conventional CD20CAR-T and AdCAR-T + LLE-rituximab (LLE-CD20 mAb) by Mann-Whitney test, p = .78. (BLI) bioluminescence. (n.s.) not significant.
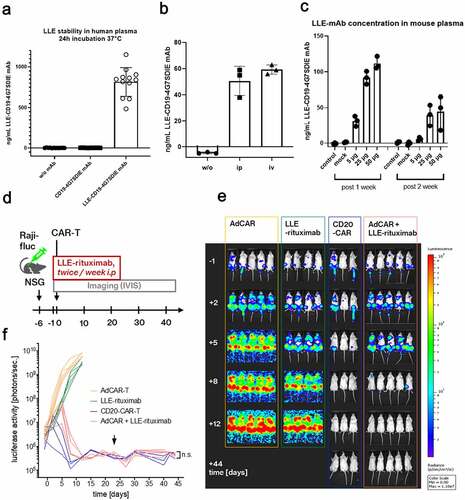
Figure 4. Universal targeting and combinatorial targeting to avoid antigen evasion
A–B) Target-antigen expression was determined by flow cytometry and calculated by Overton subtraction. Target-cell lysis was determined by LCA after incubation with AdCAR-T for 24 h at an E:T ratio of 2:1 with 10 ng/mL of the indicated LLE-mAb. Percentage of target-antigen expressing cells and normalized target-cell lysis for AML cell lines HL-60 and Kasumi-1 is shown. C–G) AdCAR-T were incubated for 48 h with an equicellular mix of antigen knockout variants of Jeko-1 (JeKo-1 WT, JeKo-1,CDCitation19KOJeKo1CDCitation20KO, and Jeko-1 CDCitation19/CDCitation20KO) at an E:T (AdCAR-T to JeKo-1) of 2:1 in the presence or absence of the 10 ng/mL LLE-CD19 mAb, LLE-CD20 mAb or LLE-ROR1 mAb or combinations thereof and analyzed by flow cytometry. C) Gating strategy to differentiate AdCAR-T (CD3 positive) and JeKo-1 (GFP positive) (left panel) and determine Jeko-1 variants by CD19 vs. CD20 staining: JeKo-1 WT (upper right), JeKo-1CDCitation19KO (upper left), JeKo-1CDCitation20KO (lower right), and Jeko-1CDCitation19/CDCitation20KO (lower left) (middle panel). Schematic illustration (right panel). D–G) to demonstrate the effect of the indicated AMs or AM combination, absolute populations (upper panel), quantification of the viability of the Jeko-1 (middle panel) and distribution of the Jeko-1 variants (lower panel) are demonstrated. Data shown in A–B) represent mean ± SEM of (n = 3) independent experiments in triplicates from 3 different donors. In D–G) representative plots and mean ± SEM of (n = 3) independent experiments of three different donors are shown.
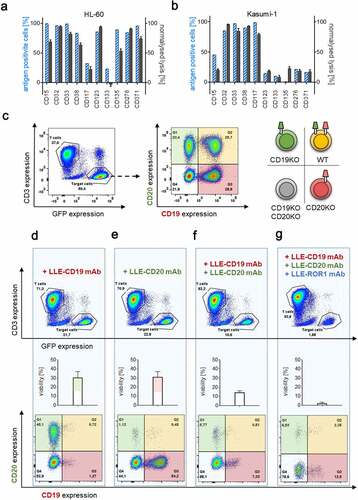
Figure 5. Sequential combinatorial targeting mediated by AdCAR-T
AdCAR-T were incubated for 48 h with an equicellular mix of JeKo-1 WT, JeKo-1,CDCitation19KOJeKo1CDCitation20KO and Jeko-1CDCitation19/CDCitation20KO at an E:T (AdCAR-T to JeKo-1 WT and KO variants) of 2:1 in the presence of either 10 ng/mL LLE-CD19 mAb (upper path) or 10 ng/mL LLE-CD20 mAb (lower path). After 48 h, distribution of AdCAR-T and JeKo-1 variants was determined by flow cytometry and either 10 ng/mL LLE-CD19 mAb or 10 ng/mL LLE-CD20 mAb was added to additional samples of each condition leading to the following four conditions: 1) LLE-CD19 mAb plus at 0 h plus LLE-CD20 mAb at 48 h (top plot, right panel), 2) LLE-CD19 mAb plus at 0 h plus LLE-CD19 mAb at 48 h (upper middle plot, right panel), 3) LLE-CD20 mAb plus at 0 h plus LLE-CD20 mAb at 48 h (lower middle plot, right panel) and 4) LLE-CD20 mAb plus at 0 h plus LLE-CD19 mAb at 48 h (bottom plot, right panel). After additional 24 h (total incubation time 72 h) distribution of AdCAR-T and JeKo-1 variants was determined by flow cytometry. The experiment demonstrates that AdCAR-T can be redirected to a second-target antigen sequentially even in the presence of the LLE-AM against the first-target antigen. Data display representative flow cytometric plots of (n = 2) independent experiments in triplicates of two different donors.
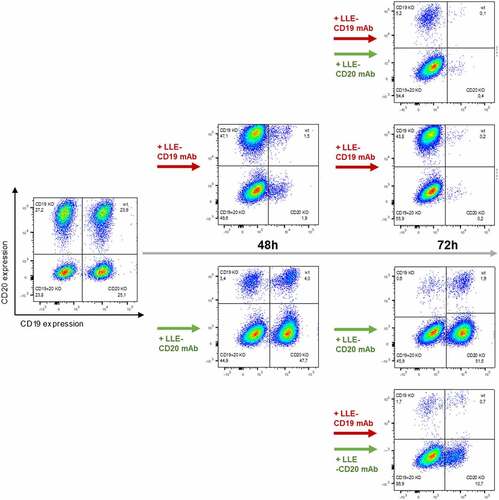
Figure 6. Surface Activation Matrix (SAM) a new concept of targeted polyimmunotherapy
A) Schematic illustration of the SAM effect. B) Schematic illustration of target cell identification and lysis by integration of antigen expression profiles. C) Target-antigen expression on JeKo-1 determined by flow cytometry. D-E) AdCAR-T were incubated with JeKo-1 at an E:T ratio of 2:1 for 48 h in presence of the indicated AMs at indicated concentrations or an additive combination of both. Target-cell lysis was determined by LCA. E) Specific lysis for 20 pg/mL LLE-CD19 mAb, 20 pg/mL LLE-CD20 mAb, and 20 pg/mL LLE-CD19 mAb + 20 pg/mL LLE-CD20 mAb as well as unspecific control LLE-mAb at 40 pg/mL is demonstrated. F) AdCAR-T were incubated with NALM6 at an E:T ratio of 1:1 for 24 h in presence of the indicated AMs or additive combinations thereof at indicated concentrations. Target-cell lysis was determined by LCA. G) AdCAR-T were incubated with LS at an E:T ratio of 2:1 for 48 h in presence of the indicated AMs or additive combinations thereof at indicated concentrations. Target-cell lysis was determined by LCA. H) AdCAR-T were incubated with Hs578T at an E:T ratio of 2:1 for 48 h in presence of the indicated AMs or additive combinations thereof at indicated concentrations. Target-cell lysis was determined by LCA. Data shown in D) represent mean of (n = 3) independent experiments from different donors in triplicates. Data shown in E) represent mean ± SEM of (n = 5) independent experiments from different donors in triplicates. Data shown in F) and G) represent mean ± SEM of (n = 2) independent experiments in triplicates from different donors. Data shown in H) represent mean ± SEM of (n = 5) independent experiments in triplicates from different donors. In E-H) significance was determined by one-way ANOVA and Tukey post hoc test. (LCA) luciferase cytotoxicity assay. Titration curve was calculated by nonlinear regression [log(agonist) vs. response] (n = 3). Uncalculated lysis curve for JeKo-1 is shown in (fig. S7A).
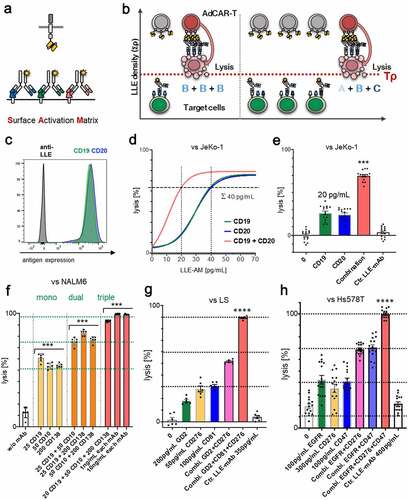
Figure 7. Identification and target cell lysis by integration of antigen expression profiles in AML
Target-antigen expression in three AML cell lines U937, HL60 and MOLM13 was determined by flow cytometry. The colors in the histoplot consistently encode the expression and lysis, targeting these five indicated potential CAR-T cell target antigens CD32, CD33, CD38, CD305, and CD371. Cytolysis at 48 h of indicated cell lines by AdCAR-T was determined by LCA in the presence of the indicated AMs at indicated concentrations or an additive combination of all five AMs. A) Target-antigen expression of U937. B–C) AdCAR-T versus U937 at an E:T ratio of 0.5:1. Titration curve was calculated by nonlinear regression [log(agonist) vs. response] (n = 2) from two different experiments from different donors in triplicates. Uncalculated lysis curve is shown in (fig. S7C). D–E) AdCAR-T versus HL60 or MOLM13 at an E:T ratio of 1:1. B–C) Specific lysis for 10 pg/mL of the individual AMs and the additive combination of all five, 10 pg/mL each ∑ = 50 pg/mL, as well as unspecific control LLE-mAb is shown. Data shown in B–E) represent mean of (n = 4) independent experiments and different donors in triplicates, respectively. In B–E) significance was determined by one-way ANOVA and Tukey post hoc test. (LCA) luciferase cytotoxicity assay.
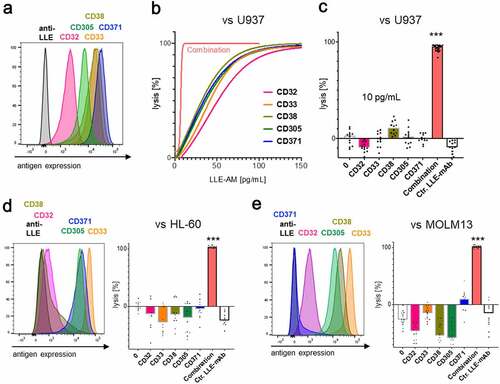
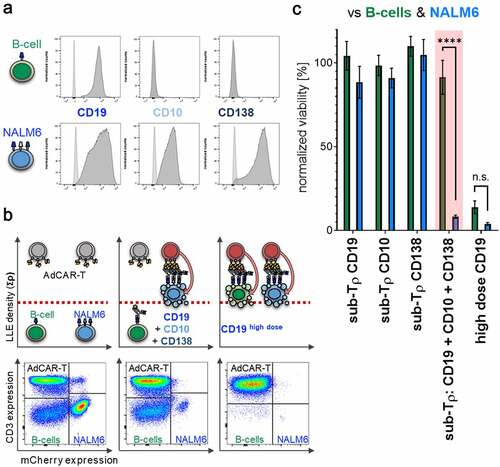
Figure 8. Differential target cell lysis by AdCAR-T
A) Target-antigen expression profile of CD19, CD10, and CD138 on freshly isolated peripheral B cells and BCP-ALL NALM6 tumor cells determined by flow cytometry. B–C) AdCAR-T were incubated for 24 h with NALM6 and freshly isolated peripheral B-cells at an E:T ratio of 2:1:1 (AdCAR-T: NALM6: B cells) in the presence or absence of 25 pg/mL LLE-CD19 mAb, 50 pg/mL LLE-CD10 mAb, or 200 pg/mL CD138-LLE mAb or the combination thereof or 10 ng/mL LLE-CD19 mAb and analyzed by flow cytometry. B) Schematic illustration of specific lysis based on differential expression profiles (upper panel). As illustrated, the combination of below threshold concentrations of AMs against the antigens CD19, CD10, and CD138, all expressed on NALM6, causes AdCAR-T activation and lysis of NALM6 while sparing B-cells only expressing CD19 (middle upper panel). In contrast, above threshold concentration of CD19 targeted AM mediates complete lysis of both NALM6 and B-cells. Representative flow cytometry plots of (n = 3) independent experiments in triplicates from three different donors are shown (lower panel). AdCAR-T are identified by CD3 expression, NALM6 by mCherry expression, B-cells by being negative for CD3 and mCherry. C) Viability of NALM6 and B cells after incubation at indicated conditions was quantified. Data shown represent mean ± SEM of (n = 4) independent experiments from four different donors in triplicates. In C) significance was determined by unpaired, two-tailed Mann-Whitney test (n = 4, p < .0001). (n.s.) not significant.
Supplemental material