
Figures & data
Figure 1. Characterization of isolated sEVs. a. FACS analysis showing the expression of CD81, CD63, and CD9 in sEVs isolated from MDA-MB-231 cells compared to MCF10-A cells (n = 6) and from plasma of TNBC patients compared to plasma of healthy female volunteers (n = 10) Results are expressed as mean±SE; p values are shown in the figure (ANOVA). b. Gated small vesicles (a) discarding debris. Representative histogram showing the distribution of sEVs. In red, positive for CD81, CD63 and CD9 in TNBC derived sEVs. In blue, CD81, CD63 and CD9 positives sEVs derived from healthy or normal breast cells. Isotype control (IgG1-APC) c. Morphology and size of isolated sEVs assessed with transmission electron microscopy. Scale bar = 100 nm. D. NTA results of sEVs isolated from 10 × 106 cells or from 10 ml plasma derived from one sample of each of the sources.
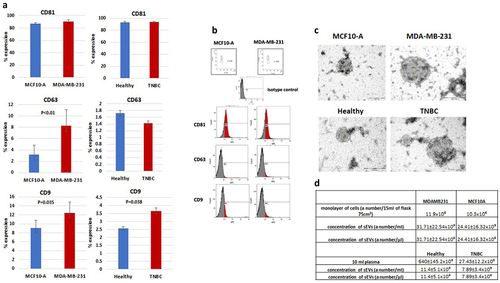
Figure 2. Expression of GalBP by TEX. a. Venn diagram depicting the percentage of 23 selected proteins revealed by mass spectrometry analysis that were expressed or contained by sEVs isolated from MDA-MB-231 and MCF10-A cells and in plasma of healthy volunteers and TNBC patients. Gal3BP as part of the 43.5% proteins expressed of the 23 selected proteins, was found in the samples from the TNBC groups. b. Bars showing the percentage of CD9 expression and CD9+/Gal3BP+ identified on sEVs isolated from normal breast cells (EX) or from TNBC cells (TEX). Results are expressed as mean±SD (n = 5); p values are shown in the figure (two-tailed t test). c. Representative dot blot showing double stained CD9+/Gal3BP+ in TEX vs EX by FACS analysis.
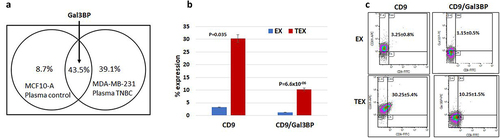
Figure 3. Formation of a complex of Gal3BP with Gal3. a. Gal3 secretion by MDA-MB-231, MCF10-A, ER+ MCF-7, and Her2+ BT474 cells. Results are expressed as mean±SD (n = 3) (two-tailed t test). b. An assay was developed to evaluate the physical interactions between Gal3BP and Gal3. c. Bars showing a linear curve shape, depending on the sample dilution. Significantly higher physical interactions between Gal3BP and Gal3 derived from MDA-MB-231 and plasma of TNBC patients cells compared to MCF10-A or plasma of healthy women in triplicate (p < 0.007). Results are expressed as mean±SD (two-tailed t-test). d. Percentage of Gal3BP protein in TEX and EX immunoprecipitated with either anti-Gal3BP or anti-Gal3 antibodies (n = 3). Results are expressed as mean±SD; p values are shown in the figure (two-tailed t test). e. Percentage of Gal3 protein in TEX or EX immunoprecipitated with either anti Gal3BP or anti Gal3 antibodies (n = 3, mean±SD) (2-tailed t test). f. Western blot analysis showing expression of Gal3 only in TEX immunoprecipitated with anti-Gal3BP. Gal3BP expression was found in EX or TEX immunoprecipitated with anti-Ga3BP. Immunoprecipitation with anti-Gal3, resulted in higher Gal3BP expression in TEX than in EX. g. Immunofluorescence of PBMCs treated with EX. CD3 (purple) expressing Gal3BP (green)/Gal3 (red) complex in EX. Scale bar = 50 μm. H. Immunofluorescence of PBMCs treated with TEX. Triple staining of Gal3BP/Gal3 complex on CD3 cells (yellow). Pictures taken under confocal microscope, nucleus stained with DAPI (blue), Scale bar = 50 μm.
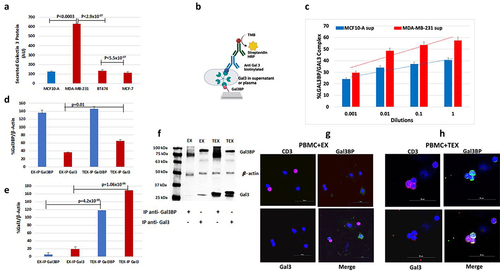
Figure 4. Gal3/Gal3BP complex binding to CD45 and inhibiting CD45 signaling pathway in TEX. A. Percentage of T cells displaying Gal3BP/Gal3 complex with and without CD45 blocking in EX- and TEX-treated cells (n = 3). Results are expressed as mean±SD (two-tailed t test). B. Representative dot blot of FACS analysis of CD3+ gated cells expressing Gal3BP/Gal3 complex. C. Percentage of Lck Y505, Lck Y394, ZAP-70 Y493 and VAV-1 Y174 phosphorylation in PBMCs treated with EX, TEX, or complex (Gal3BP and Gal3 recombinant proteins). D. Representative histogram showing phosphorylation of proteins in the CD45 pathway after treatment with EX (red) or TEX (blue).
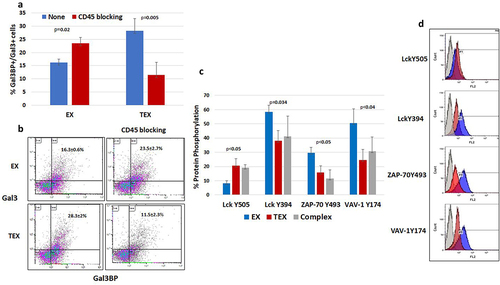
Figure 5. Effect of CD45 blocking on Gal3BP/Gal3 protein-induced immunosuppression. a. Percentage of Treg cells (CD4+/CD25+FOXP3+) in PBMCs treated with EX compared to TEX or Gal3BP/Gal3 complex ± CD45 blocking. Results are expressed as mean±SE (n = 4) (p value by ANOVA). b. Representative dot blot of FACS data showing percentage gated CD4 cells expressing CD25-APC and FOXP3-FITC (Treg cells) in EX- or TEX-treated cells. c. IL-10 and IL-35 were detected in supernatants of PBMCs treated with either TEX or EX from the different experiments. IL-10 secretion by cells. Results are expressed as mean±SE (n = 6) (p value by ANOVA). d. IL-35 secretion by cells. Results are expressed as mean±SE (n = 7); (p values by ANOVA). e. IFNγ secretion of lymphocytes incubated with TEX or TEX+GW4869 (an inhibitor of exosome secretion) and with/without CD45 blocking. f. Percentage of activated T and NK cells after incubation of lymphocytes with EX or TEX with/without CD45 blocking. Results are expressed as mean±SE (n = 4); p values by ANOVA). g. Representative dot blot of FACS data.
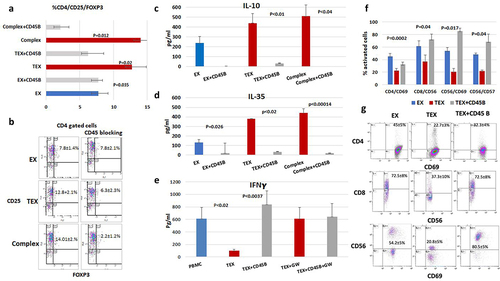
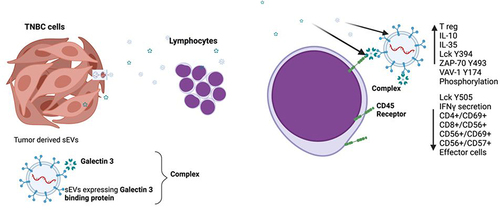
Figure 6. A new TNBC immunosupressive mechanism. Gal3BP/Gal3 complex secreted by TNBC cells induces immunosuppression through the CD45 receptor on T cells.
Supplemental Material
Download Zip (769.1 KB)Data availability statement
All data relevant to the study are included in the article or are uploaded as supplementary information. Additional data are available on request.