
Figures & data
Figure 1. (a) forest plot showing the hazard ratio (HR) for overall survival (OS) in ccRCC patients with high versus low expression of genes involved in steroidogenesis. Patients were dichotomized into high vs. low gene expression groups based on the median expression values as threshold. HR is represented on a logarithmic scale, HR > 1 indicates that high expression of the gene correlates with a shorter OS. (b) simplified diagram of the glucocorticoid pathway. (C) heat map representing hierarchical clustering analysis of genes involved in glucocorticoid metabolism. (d) probability of survival for patients segregated based on the hierarchical clustering. **p-value <10−2, ***p-value <10−3, ****p-value <10−4. (e) expression levels for immune checkpoints and Th2 gene signature in patients with high vs. low HSD11B1 expression. Data are shown as mean ± SEM of 445 (low hsd11b1 expression) and 57 patients (high hsd11b1 expression), ****p-value <10−6.
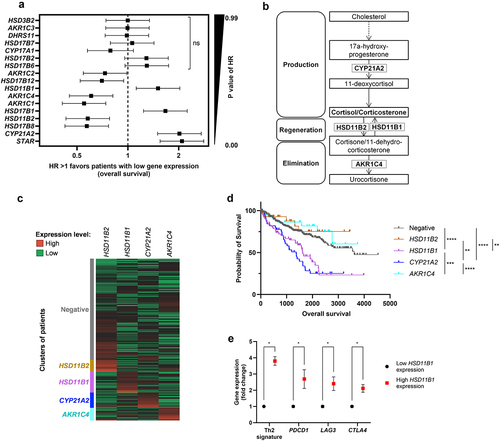
Figure 2. (a) human RCC sample from tumor block stained for HSD11B1 (brown) by immunohistochemistry. The right picture is a zoom in section. The arrows indicate infiltrating cells positive for HSD11B1 with a macrophage morphology. (b) percentage of cells positive for HSD11B1 in tumors from 20 patients with RCC. (c) representative immunohistochemistry staining for CD68, HSD11B1 and hematoxylin in four RCC tumor specimens from patients. Arrows show colocalization of HSD11B1 and CD68.
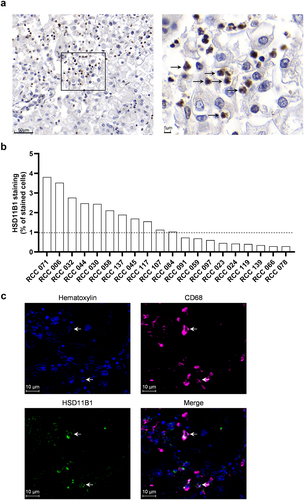
Figure 3. Relative IFN-γ levels secreted by PBMC from a healthy donor (a) and immune cells enriched from a human RCC tumor (b), following antigen recall stimulation. In absence of cortisone, there was no effect of ABT-384 on the level of IFN-γ in stimulated or non-stimulated conditions (data not shown). Fold change compared to the condition with cortisone, isotype and without HSD11B1 inhibitor is represented as mean ± SEM of 3 technical replicates in one experiment. *p-value <0.05, **p-value <10−2, ***p-value <10−3, ****p-value <10−4. A. Data are representative of 3 independent experiments on the same donor. Similar results were obtained with 2 other donors tested in one experiment. B. out of 4 patients tested, only the patient shown had a response to antigen recall.
Figure 4. (a) determination of HSD11B1 activity by the measurement of plasma cortisol-d3 levels in naive mouse after administration of cortisol-d4 ± the HSD11B1 inhibitor ABT-384. Data are shown as mean ± SEM of 3 mice per group. **p-value <10−2. (b) growth kinetics of subcutaneous Renca tumors. Data are shown as mean of tumor area ± SEM of 8 mice per group. Statistical analysis at day 14, *p-value <0.05, ****p-value <10−4. (c-d) immunophenotyping results of the tumor by FACS. CD44−CD62L− CD4+ were defined as effector CD4+ cells and are represented as % of total CD4+ cells. (c) MDSC/DC ratio calculated based on the % of MDSC/CD45+ cells and % of DC/CD45+ cells (figureS6). (d) Data are shown as mean ± SEM of 8 mice per group. *p-value <0.05, **p-value <10−2. Animal experiments were performed once.
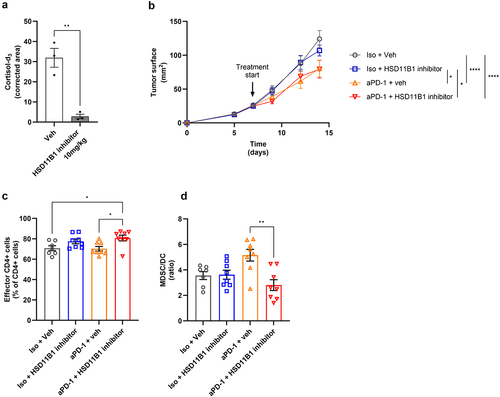
Figure 5. (a) comparison of corticosterone/11-DHC ratio in plasma and kidney of naive mice. Data are shown as mean ± SEM of 12 mice per group. ***p-value = 5×10⁻⁴. (b) determination of HSD11B1 activity by the measurement of cortisol-d3 levels in kidneys of naive mice after administration of cortisol-d4 ± the HSD11B1 inhibitor ABT-384. Data are shown as mean ± SEM of 3 mice per group. ***p-value <10−3. (c) representative images of a mouse with an intrarenal Renca tumor. Coronal (left) and axial views (upper right) of theCitation15F]FDG PET/CT scan (back of the mouse on the top). The lower right image corresponds to the axial view of the MRI scan. Tumor is pointed by the asterisks. (d) Corticosterone/11-DHC ratio in plasma of renal tumor-bearing mice. Data are shown as mean ± SEM of 6 to 9 mice per group. *p-value <0.05, **p-value <10−2. (e) probability of survival over time in mice bearing intrarenal Renca tumors based on the tumor volume. Tumor volume >200 mmCitation3 considered as event of death, 10 mice per group. Statistical analysis: log-rank (Mantel-Cox) test. Animal experiments were performed once.
![Figure 5. (a) comparison of corticosterone/11-DHC ratio in plasma and kidney of naive mice. Data are shown as mean ± SEM of 12 mice per group. ***p-value = 5×10⁻⁴. (b) determination of HSD11B1 activity by the measurement of cortisol-d3 levels in kidneys of naive mice after administration of cortisol-d4 ± the HSD11B1 inhibitor ABT-384. Data are shown as mean ± SEM of 3 mice per group. ***p-value <10−3. (c) representative images of a mouse with an intrarenal Renca tumor. Coronal (left) and axial views (upper right) of theCitation15F]FDG PET/CT scan (back of the mouse on the top). The lower right image corresponds to the axial view of the MRI scan. Tumor is pointed by the asterisks. (d) Corticosterone/11-DHC ratio in plasma of renal tumor-bearing mice. Data are shown as mean ± SEM of 6 to 9 mice per group. *p-value <0.05, **p-value <10−2. (e) probability of survival over time in mice bearing intrarenal Renca tumors based on the tumor volume. Tumor volume >200 mmCitation3 considered as event of death, 10 mice per group. Statistical analysis: log-rank (Mantel-Cox) test. Animal experiments were performed once.](/cms/asset/ab5557f6-1379-423d-98c2-1fb0d6133dce/koni_a_2286820_f0005_oc.jpg)
Figure 6. (a) growth kinetics of subcutaneously implanted Renca tumors. Treatments were initiated at day 7. Data are shown as mean of tumor area ± SEM of 7 to 8 mice per group. Statistical analysis at day 14, **p-value <10−2, ****p-value <10−4. (b-d) immunophenotyping results of the tumors by flow cytometry. Percentage of CD4+, CD8+ (b), MDSC, and DC (d) represented as ratio of cell populations. CD206 expression (c) represented as mean fluorescence intensity (MFI) of CD206 on macrophages in the tumor. Data are shown as mean ± SEM of 7 to 8 mice per group. *p-value <0.05, **p-value <10−2. Animal experiments were performed once.
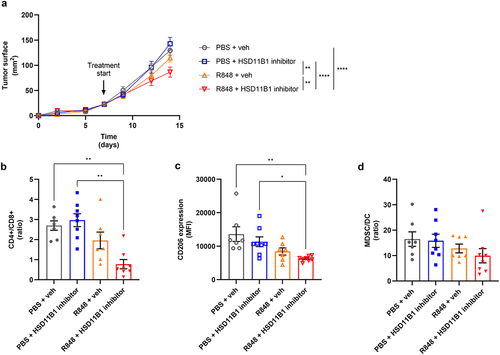
Figure 7. (a) HSD11B1 expression by Western blot in mouse bone marrow-derived dendritic cells, liver and spleen. (b) experimental design of T cell-mediated tumor cytotoxicity assay. C, D. surface CD86 (c) and MHCII (d molecules on bone marrow-derived dendritic cells measured by flow cytometry at D1. Results are expressed as fold change of the MFI, relative to the control condition. Data are shown as mean ± SEM of 3 technical replicates of one experiment. (e) measurement of Renca H2-kb GFP tumor cell growth exposed to antigen stimulated CD8+ T cells. Results are expressed as % of tumor cell growth normalized to the seeding density. Data are shown as mean ± SEM of 3 replicates and representative of 3 independent experiments. *p-value <0.05, ***p-value <10−3, ****p-value <10−4.
Figure S9B.tif
Download TIFF Image (9 MB)Figure S9C.tif
Download TIFF Image (9.2 MB)Figure S8.tif
Download TIFF Image (1.8 MB)Figure S2.tif
Download TIFF Image (681.4 KB)Figure S4_2nd_rev.tif
Download TIFF Image (587.7 KB)Tables of supplementary material and method.docx
Download MS Word (27 KB)Figure S5.tif
Download TIFF Image (1.3 MB)Figure S1.tif
Download TIFF Image (992.5 KB)Poinot et al Supplemental_text_2nd_rev.docx
Download MS Word (62.8 KB)Figure S7.tif
Download TIFF Image (1 MB)Figure S9A.tif
Download TIFF Image (9.5 MB)Figure S3.docx
Download MS Word (19.6 KB)Figure S6.tif
Download TIFF Image (1.8 MB)Data availability statement
The data that support the findings of this study are available from the corresponding authors [CB, AP], upon reasonable request.