Figures & data
Figure 1. Spatial distribution of CD8+ T cells, NCR1+ NK cells, and PD-L1+ cells in NB patients.
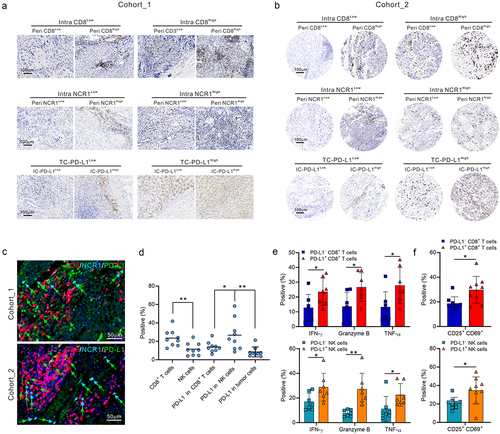
Figure 2. ScRNA-seq analysis reveals that PD-L1-positive NKT and NK cells have an activated status in NB tumor.
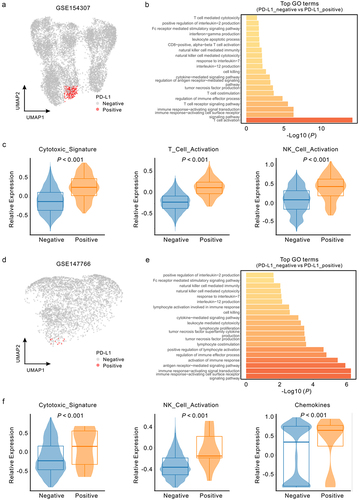
Table 1. Univariate and multivariate analysis of overall survival and event-free survival in neuroblastoma patients.
Figure 3. Expression levels of intratumoral CD8 and intratumoral NCR1 correlate with increased survival in NB patients regardless of immune cell-PD-L1 expression.
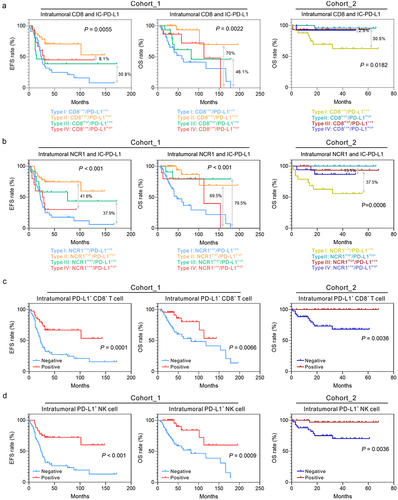
Figure 4. Intratumoral NCR1 expression levels correlate with increased survival in NB patients regardless of PD-1 expression and the density and spatial distribution of CD8+ T cells.
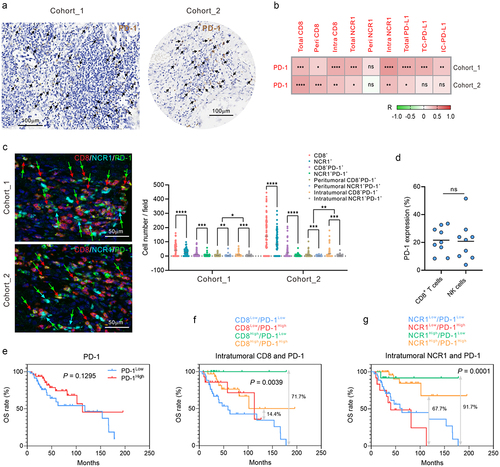
Figure 5. Cytotoxicity of CD8+ T or NK cell combined with anti-PD-1/PD-L1 antibodies to NB cells in vitro.
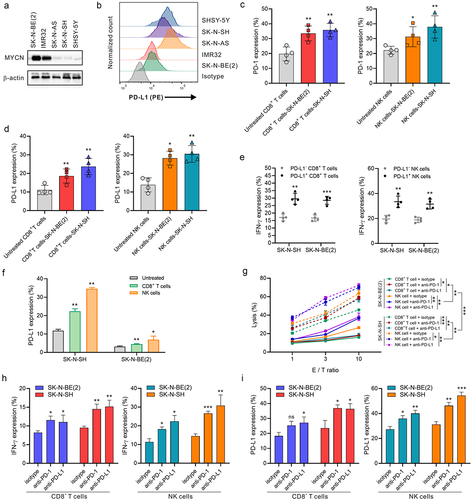
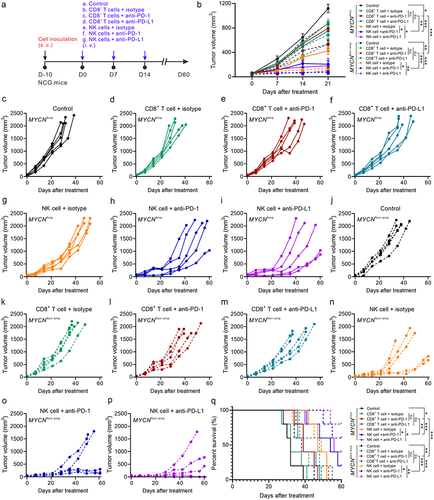
Figure 6. Antitumor activity of CD8+ T or NK cell combined with PD-1/PD-L1 blockade in xenograft models of NB.