
Figures & data
Figure 1. Study design.
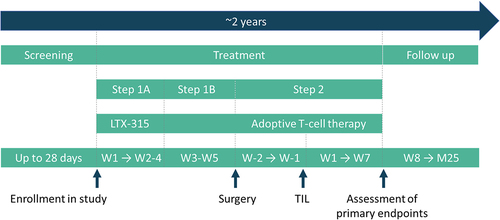
Table 1. Baseline patient demographics.
Table 2. Treatment data.
Figure 2. IHC data before and after LTX-315 treatment.
Dot plot showing IHC data from tumor at baseline and after LTX-315 injections. (A) Necrosis are shown in percentage necrosis in the available tumor sample. Increased necrosis was noticed in three of six samples following LTX-315. (b-d) CD3+, CD4+ and CD8+ infiltration in the injected tumor as measured by IHC. (e) CD3+, CD4+, and CD8+ infiltration in a bystander lesion (non-injected tumor) at baseline and 19 weeks post LTX-315 treatment. T-cell infiltration is shown as cells/mm2.
Table 3. Adverse events related to therapy.
Figure 3. Tumor response assessed by RECIST1.1.
Clinical effect of the treatment measured by RECIST 1.1. On the vertical axis are changes in the sum of target lesions and on the horizontal axis are time from baseline. A white circle at the end of a line refers to clinical PD determined by the treating physician.
Figure 4. Characteristics and reactivity of TIL and PBMC.
(a) Stacked bar plot showing phenotype of infused cells. (b) Bar plot showing percentage of tumor-reactivity in infused cells assessed by flow cytometry. (c) Stacked bar plot showing functional changes in reactive TILs when co-cultured with autologous tumor fresh tumor digest. (d) Heatmaps showing reactivity of PBMC, and infused TIL analyzed with IFNγ ELISPOT. Data are shown for the individual patients with target cells/peptides on the vertical axis and TIL/PBMC (chronologically) on the horizontal axis. Color intensity shows the difference between spot count of the test samples (mean of triplicates) and the negative control.
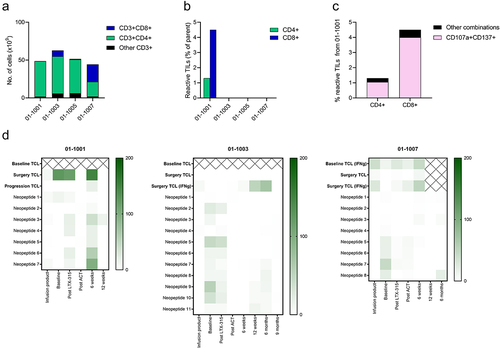
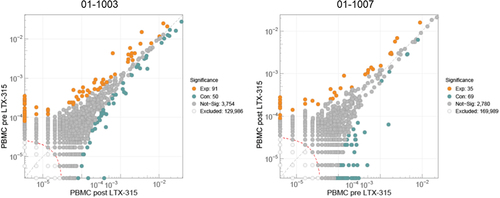
Figure 5. LTX-315 induces a polyclonal tumor-associated T-cell response in PBMC.
Graph showing the abundance of unique T-cell clones in blood (peripheral blood mononuclear cells) before treatment compared with 17-22 days after initiation of LTX-315 treatment. T-cell clones that were not significantly changed in frequency are depicted in gray, whereas those that were significantly expanding, or contracting are depicted in red or blue, respectively. Dashed diagonal gray line defines frequency equality, and dashed red line defines threshold for statistical comparison.
Supplemental material
Supplementary material.docx
Download MS Word (312.4 KB)Data availability statement
The data that support the findings of this study are available from the corresponding author, [author initials], upon reasonable request.