
Figures & data
Figure 1. Tumor growth was not arrested after late administration of anti-PD-1 antibody.
C57BL/6J mice were subcutaneously implanted with B16 (1 × 10⁶) or Lewis lung carcinoma (1 × 10⁶) cells on the right flank and treated with anti-PD-1 antibody (200 μg, i.p., every other day four times) starting on day 7 or 14. Tumor growth was measured every 2 d (B16) or 3 d (LLC). a and b, B16 melanoma tumor growth (a) and survival of mice (b) treated with anti-PD-1 antibody starting from days 7 and 14 after tumor inoculation. c and d, Lewis lung carcinoma growth (c) and survival of mice (d) treated with anti-PD-1 antibody starting from days 7 and 14 after tumor inoculation. e-h, Tumor-infiltrating CD8+ T cells of B16 melanoma tumors analyzed via flow cytometry for IFN-γ (e), TNF-α (f), Ki67 (g), and CD69 (h). I and J, Expression of coinhibitory receptors PD-1 TIM3 and LAG3. Differences in survival curves between groups were analyzed using the log-rank (Mantel – Cox) test. Data are presented as mean ± SEM. of n = 5 mice per group. P values were calculated by two-tailed unpaired Student’s t-test (*, P < 0.05; **, P < 0.01; ***, P < 0.001; ****, P < 0.001; ns, not significant).
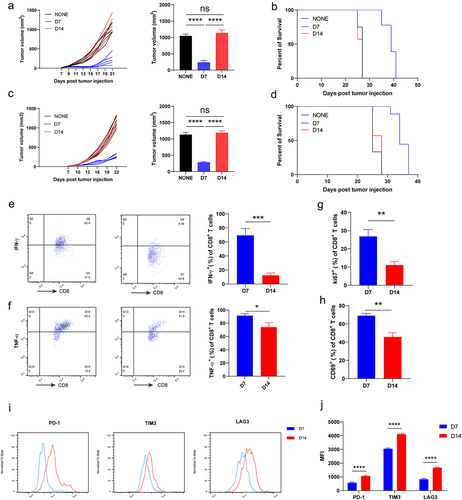
Figure 2. LFA-1 expression on intratumor CD8+ T cells decreased with tumor progression.
a, Principal analysis of tumor-infiltrating CD8+ T cells from days 7 and 14 after B16 tumor inoculation. b-e, heat map(b), volcano plot(c), pathway analysis (d), and gene set enrichment (e) of different genes between tumor-infiltrating CD8+ T cells from days 7 and 14 after B16 tumor inoculation. F, ITGAL mRNA expression in tumor-infiltrating CD8+ T cells from days 7 and 14 after B16 tumor inoculation. g and h, LFA-1 expression in tumor-infiltrating CD8+ T cells on days 7 and 14 after B16 tumor inoculation. i, Correlation analysis indicated a relationship between ITGAL expression and the expression of T-cell activation- and proliferation-associated genes. Data are presented as mean ± SEM. *P < 0.05; **P < 0.01; ***P < 0.001. j, Summary graphs showing the expressions of IFN-γ, TNF-α, CD69, and Ki67 in LFA-1high and LFA-1low tumor-infiltrating CD8+ T cells. Data are presented as mean ± SEM. of n = 3 biologically independent experiments. P values were calculated by two tailed unpaired Student’s t-test. *, P < 0.05; **, P < 0.01; ***, P < 0.001; ****, P < 0.001.
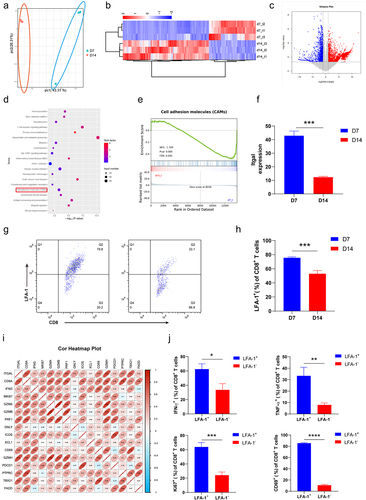
Figure 3. LFA-1 mediated immune synapse was responsible for increased antitumor functions of CD8+ T cells.
Tumor-infiltrating CD8+ T cells were isolated on days 7 and 14 after B16 tumor inoculation, then incubated with B16 cells and analyzed via imaging flow cytometry for the formulation of immune synapse. a, Representative MIFC images of CD8+ T-cell/B16-cell couples. Conjugates of CD8+ T cells and B16 tumor cells were stained for B16 (green), LFA-1 (red), or F-actin (phalloidin, pink). Nuclei were stained with Hoechst (blue). 20000 events were acquired per sample. The pictures are representative of 3–4 independent experiments (mean, SE). b, LFA-1 expression in tumor-infiltrating CD8+ T cells 7 and 14 days after B16 tumor inoculation. c, Enrichment of LFA-1 (b) and F-actin (c) in the CD8+ T-cell/B16-cell contact zone. d, Flow cytometry analysis of Annexin V + B16 cells coincubated with tumor-infiltrating CD8+ T cells from days 7 and 14 after B16 tumor inoculation in vitro. e, The contents of IFN-γ and IL-2 in supernatant from coincubation were detected via enzyme linked immunosorbent assay. si-NC and si-ITGAL tumor-infiltrating CD8+ T cells from day 7 were incubated with B16 cells and analyzed using flow cytometry for the formulation of immune synapses. f, Representative MIFC images of CD8+ T-cell/B16-cell couples. Conjugates of CD8+ T cells and B16 tumor cells were stained for B16 (green), LFA-1 (red), or F-actin (phalloidin, pink). Nuclei were stained with Hoechst (blue). 20000 events were acquired per sample. The pictures are representative of 3–4 independent experiments (mean, SE).g, LFA-1 expression in si-NC- and si-ITGAL-transfected tumor-infiltrating CD8+ T cells from day 7 after B16 tumor inoculation.H, Enrichment of LFA-1 (f) and f-actin (g) in the CD8+ T-cell/B16-cell contact zone. i, Flow cytometry analysis of apoptosis in B16 cells coincubated with si-ITGAL and si-NC tumor-infiltrating CD8+ T cells in vitro. j, Contents of IFN-γ and IL-2 in supernatant from coincubation was detected via enzyme linked immunosorbent assay. Data are presented as mean ± SEM. of n = 3 biologically independent experiments. P values were calculated by two tailed unpaired Student’s t-test. *, P < 0.05; **, P < 0.01; ***, P < 0.001; ****, P < 0.001.
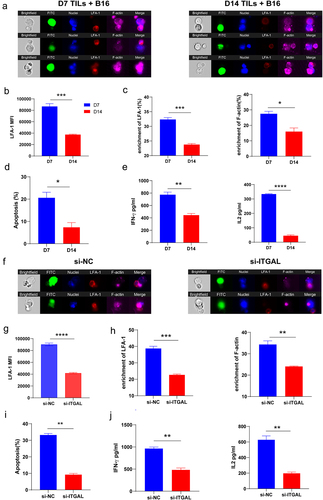
Figure 4. Low IL2/STAT5 signaling downregulated LFA-1 expression in tumor-infiltrating CD8+ T cells.
a, Tumor-infiltrating CD8+ T cells were treated with PBS, STAT1 inhibitor (fludarabine), STAT3 inhibitor (Stattic), STAT5 inhibitor (BD750), and STAT6 inhibitor (AS1517499) for 24 h in vitro. Expression of LFA-1 was determined via flow cytometry. b, Tumor-infiltrating CD8+ T cells were treated with PBS, STAT5 inhibitor (BD750), IL-2, and BD750+IL2 for 24 h and then coincubated with B16 tumor cells. The expression of LFA-1 was determined using flow cytometry. c, STAT5 depleted or control tumor-infiltrating CD8+ T cells, with or without IL-2, stimulated for 24 h were coincubated with B16 tumor cells. Representative MIFC images of CD8+ T-cell/B16-cell couples. Conjugates between CD8+ T cells and B16 tumor cells were stained for B16 (green), LFA-1 (red), or F-actin (phalloidin, pink). Nuclei were stained with Hoechst (blue). 20000 events were acquired per sample. The pictures are representative of 3–4 independent experiments (mean, SE). d and e, Enrichment of LFA-1 (d) and F-actin (e) in the CD8+ T-cell/B16-cell contact zone.f and g, CD8+ T cell:B16 = 10:1, after 24 h coincubation; cells were labeled with CD8, Annexin V, and 7-AAD; and the apoptosis of CD8− cells was determined using flow cytometry (f). Contents of IFN-γ and IL2 in supernatant from coincubation was detected using enzyme linked immunosorbent assay (g). h–j, D7 Tumor-infiltrating CD8+ T cells were transfected with si-Control, si-STAT5-1, or si-STAT5-2 for 48 h. Western blotting analysis of STAT5 relative expression (h) in CD8+ T cells. After tumor-infiltrating CD8+ T cells were transfected with si-Control or si-STAT5 for 48 h and treated with or without IL-2 for 24 h, the expression of LFA-1 (i) was determined using flow cytometry. CD8+ T cell:B16 = 10:1; after 24 h coincubation, cells were labeled with CD8, Annexin V, and 7-AAD, and the apoptosis (j) of CD8− cells was determined using flow cytometry Data are presented as mean ± SEM. of n = 3 biologically independent experiments. P values were calculated by two-tailed unpaired Student’s t-test (*, P < 0.05; **, P < 0.01; ***, P < 0.001; ****, P < 0.001; ns, not significant).
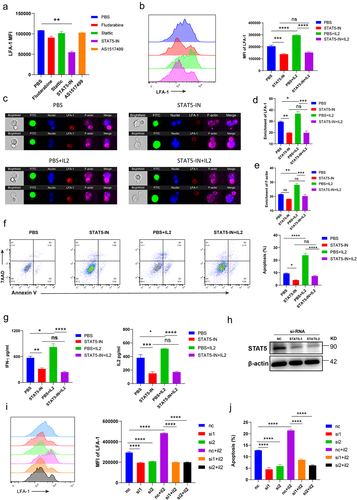
Figure 5. IL-2/STAT5 signaling regulated LFA-1 expression.
a, Before Chip-qPCR, D7 tumor-infiltrating CD8+ T cells were treated with or without IL2 for 48 h in vitro. ChIP – qPCR analysis was performed using pSTAT5 or IgG antibodies and ITGAL-promoter-specific primers.b, Luciferase activity was examined when PBS, ITGAL-OE, and ITGAL-MUT promoter-luc mixed with NC, STAT5A, and STAT5B were transfected into 293T cells. c–e, Tumor-infiltrating CD8+ T cells from day 7 after B16 tumor inoculation were isolated and treated with none, IL-2, or a combination of IL2 and the STAT5 inhibitor BD750 for 12 hours. The cells were stained with anti-LFA-1 and anti-p-STAT5 antibodies, and the nuclei were stained with Hoechst 33,342. 10000 events were acquired per sample. The pictures are representative of 3–4 independent experiments (mean, SE).c, Representative pictures show the similarity of p-STAT5 and Hoechst. d, The level of pSTAT5 translocation from the cytosol to the nucleus.e, Expression of LFA-1 in CD8+ T cells was analyzed using IDEAS 3.0.Data are presented as mean ± SEM. of n = 3 biologically independent experiments. P values were calculated by two-tailed unpaired Student’s t-test (*, P < 0.05; **, P < 0.01; ***, P < 0.001; ****, P < 0.001; ns, not significant).
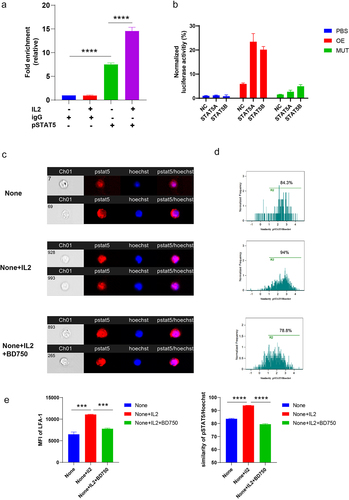
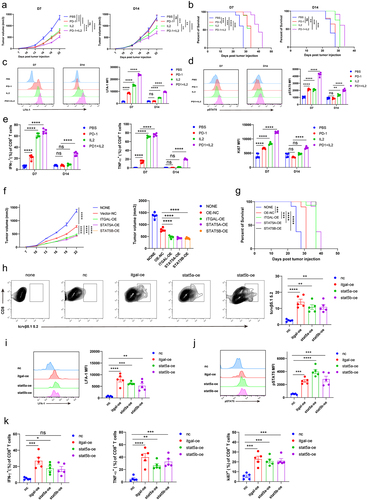
Figure 6. Activating IL2/STAT5/LFA-1 signaling enhanced antitumor function of CD8+ T cells.
a – e, B16-bearing C57BL/6 mice were left untreated or treated with anti-PD-1 antibodies, IL-2 therapy, or combination therapy starting from D7 or D14. Tumor growth was measured every 3 days. Tumor growth (a) and mouse survival (b). The expressions of LFA-1 (c), pSTAT5 (d), IFN-γ, TNF-α, and Ki67 (e) were analyzed using flow cytometry on day 22. f – k, Splenocytes from OT-1 mice were stimulated with OVA peptides and IL-2 for 2 days in vitro. Transfection with control, ITGAL-OE, STAT5A-OE, and STAT5B-OE 7 days after B16-OVA tumor inoculation, 2 × 10⁶ without or transfection with control ITGAL-OE, STAT5A-OE, or STAT5B-OE OT-1+. CD8+ T cells were i.v. injected into tumor-bearing mice. Tumor growth was measured every 3 days. Tumor growth (f) and mouse survival (g). Relative numbers of transferred OT1+ CD8+ T cells were measured using flow cytometry on day 14 after T-cell transfer (h). The expressions of LFA-1 (i), pSTAT5 (j), IFN-γ,TNF-α, and Ki67 (k) were analyzed using flow cytometry on day 14 after T-cell transfer. Differences in survival curves between groups were analyzed using the log-rank (MantelCox) test.Data are presented as mean ± SEM. of n = 5 mice per group. P values were calculated by two-tailed unpaired Student’s t-test (*, P < 0.05; **, P < 0.01; ***, P < 0.001; ****, P < 0.001; ns, not significant).
Supplemental material
Supplemental Material
Download Zip (2.8 MB)Data availability statement
The date supporting the finding of this study are available from the corresponding author upon reasonable request.