
Figures & data
Table 1. Demographic and clinical characteristics of the two cohorts.
Figure 1. Description of PDAC immune populations and their associated prognostic value.
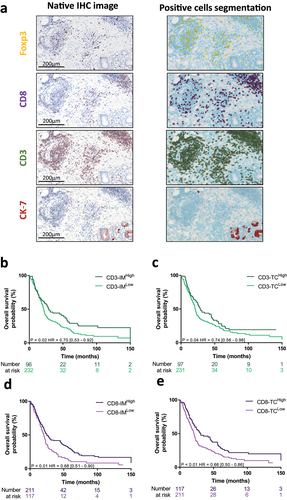
Figure 2. Immune score combining CD3 and CD8 IHC markers is associated with PDAC prognosis.
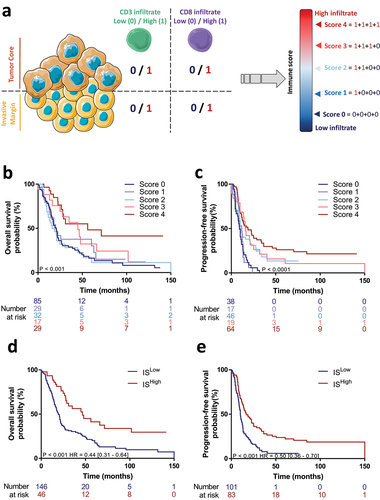
Table 2. Univariate and multivatiate Cox models for overall survival in the whole cohort (complete data for n = 280 patients).
Table 3. Univariate and multivatiate Cox models for progression-free survival in the whole cohort (complete data for n = 273 patients).
Figure 3. Improved prognostic value for PDAC outcome with a combination of clinical features and immune score.
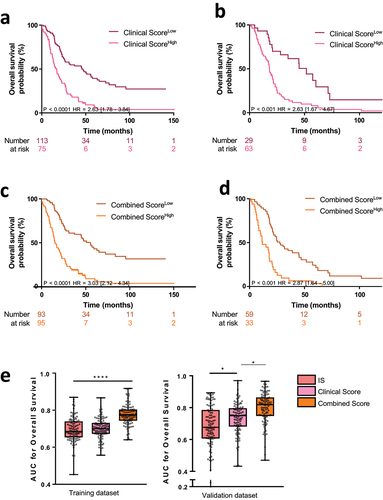
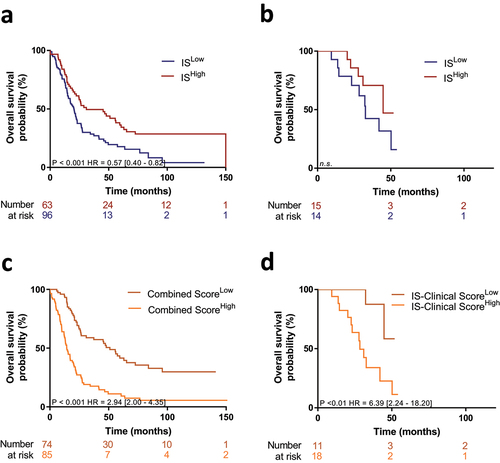
Figure 4. Combined score associating immune score and clinical score is associated with PDAC prognosis regardless of neoadjuvant or adjuvant chemotherapy.
Supplemental_Figures_Schoumacher_revised.docx
Download MS Word (410.1 KB)Supplementary_Methods1_SM1_CGE_investigators_list.docx
Download MS Word (11.8 KB)Supplementary_Methods2_SM2_Schoumacher.docx
Download MS Word (205.3 KB)Data availability statement
Date are available on reasonable request.