Figures & data
Figure 1. Irf4-/- CD4+ T cell induce less aGVHD and GVHD associated colitis.
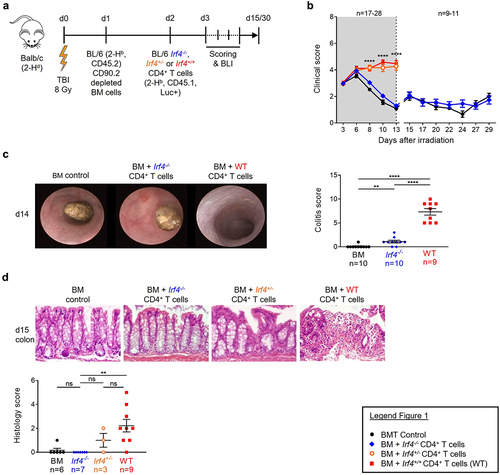
Figure 2. Irf4-/- CD4+ T cells show decelerated proliferation but migrate to the same aGVHD target organs like WT and Irf4± CD4+ T cells.
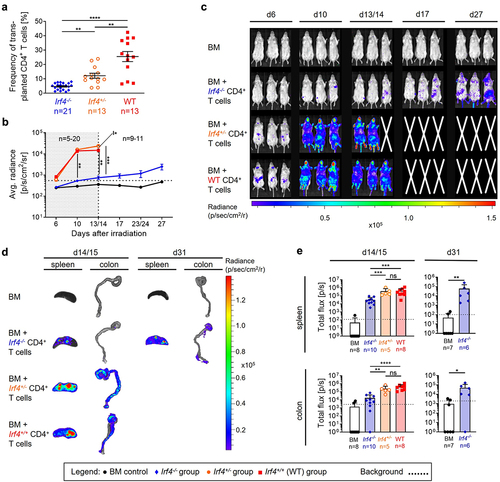
Figure 3. RNA sequencing analysis of re-isolated CD45.1+ CD4+ T cells shows differences in the transcriptomic landscape between transplanted Irf4+/- and Irf4-/- cells and reflects the observations described in vivo.
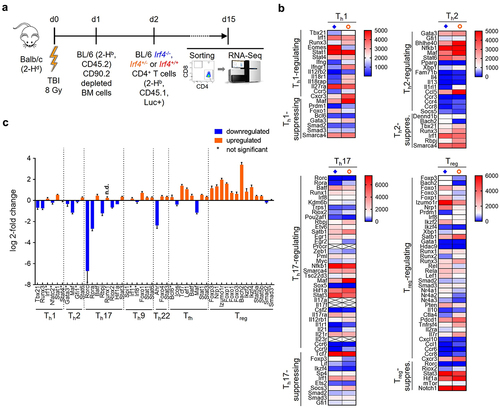
Figure 4. Irf4-/- CD4+ T cells exhibit an altered memory/effector and a compromised Th phenotype on comparison to Irf4+/- and WT CD4+ T cells.
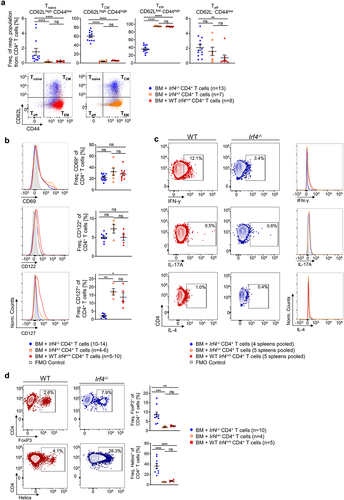
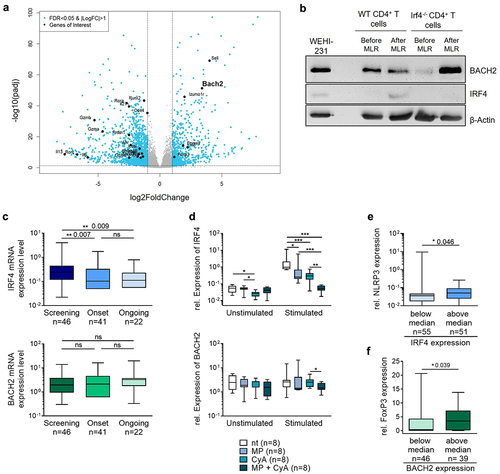
Figure 5. IRF4 but not BACH2 expression are altered by GVHD immunosuppressant therapy and influence inflammatory versus anti-inflammatory signatures in intestinal biopsies of GVHD patients.