
Figures & data
Figure 1. Overview of procedures for inclusion of participants for BIG-Thera study.
Table 1. Cohort of patients analyzed for immune cell populations in breast cancer and surrounding unaffected tissue.
Table 2. Antibody staining panel for identification of immune cells in breast cancer and surrounding unaffected tissue.
Figure 2. High-dimensional analysis of the immune cell signature in breast cancer tissue using unbiased approaches. Single cell suspensions of breast cancer samples and unaffected tissue of the same patients were stained with a panel of 21 fluorochrome-coupled monoclonal antibodies. Cells were acquired using a BD LSRFortessa and analyzed using FlowJo (version 10, BD Biosciences). a) Gating strategy to identify CD45+ immune cells in the samples of breast cancer patients. After gating for the morphology of cells (FSC-A/SSC-A), doublets (FSC-A/FSC-H), dead cells (DAPI+) and cancer cells (CD324/CD326/CD340+) were excluded. Then, CD45+ immune cells were selected and the frequency among all viable cells determined. b) Scatter plot shows frequency of CD45+ immune cells among all viable cells for all breast cancer samples as well as unaffected surrounding tissue of the same patient (Student’s t-test; * p < 0.05, ** p < 0.01). c) UMAP analysis and overlay with cell clusters identified using X-Shift are shown as dot plot for merged sample. d) The merged samples were split up into unaffected and breast cancer tissue. Dot plots show the results of the UMAP analysis overlaid with the identified clusters using X-Shift. e) Frequency of each cluster among the CD45+ immune cells was determined. Scatter plots show clusters that differ significantly between unaffected and breast cancer tissue (Student’s t-test; * p < 0.05, ** p < 0.01). f) Breast cancer samples were grouped into untreated and chemotherapy (CT)-treated samples. Scatter plots show clusters that differ significantly between treated and untreated breast cancer samples (Student’s t-test; * p < 0.05, ** p < 0.01).
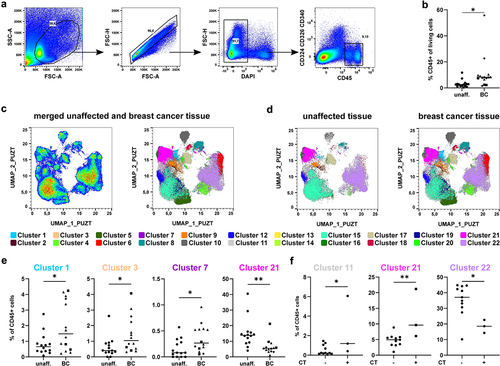
Figure 3. Identification of subtype-specific immune cell alterations in breast cancer samples. a) Merged samples from Figure 2 were split up into the original files after UMAP and X-Shift analysis. Dot plots show a representative donor for unaffected tissue, Luminal A-type BC, HER2-enriched (HER2+) BC, and TNBC. Dot plots were overlaid with the identified clusters by X-Shift and color-coded according to Figure 2. b) Scatter plot shows the frequency of CD45+ immune cells among all viable cells (determined for each sample as in Figure 2a; one-way ANOVA with Dunnett’s multiple comparison test; * p < 0.05, ** p < 0.01, *** p < 0.001, **** p < 0.0001). c) Frequency of each cluster among CD45+ immune cells in each tissue sample were determined and plotted as scatter plot. Shown are clusters displaying significant differences between unaffected tissue and one of the analyzed BC subtypes (one-way ANOVA with Dunnett’s multiple comparison test; * p < 0.05, ** p < 0.01, *** p < 0.001, **** p < 0.0001).
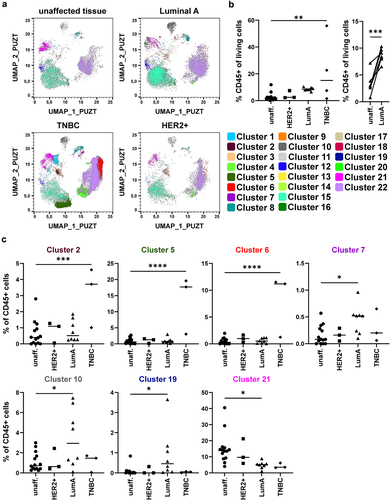
Figure 4. Identification of immune cell phenotype in X-Shift clusters using ClusterExplorer. Cells contained in the 22 clusters identified by X-Shift analysis in the merged file containing all 14 BC and 14 unaffected tissue samples were analyzed for the expression of the stained markers using the FlowJo plugin ClusterExplorer and plotted as heatmap. Heatmap depicts the expression of the 17 markers used for the identification of the X-Shift clusters. Dependent on the expression pattern, cells were assigned to the indicated cell populations on the right side of the heatmap. Signal intensity is color coded from blue (low expression) to red (high expression).
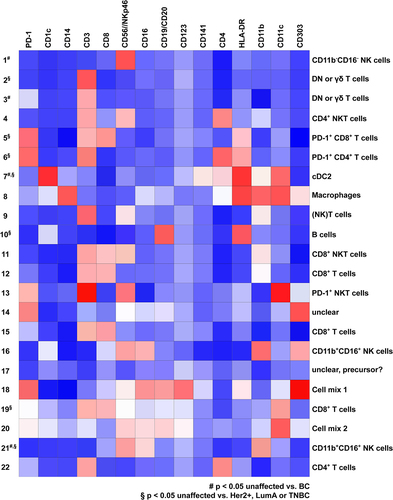
Figure 5. Validation of the identified alterations in the NK cell, T cell, B cell, and cDC2 compartment using a second cohort of BC patients. In order to validate the identified alterations using the unbiased approach, NK cells, T cells, B cells, and cDC2 were analyzed in the samples of the first cohort and in additional donors of a second cohort. Cells were gated according to Figure S5. a) Frequency of NK cells among CD45+ immune cells was determined. b) NK cells were analyzed for expression of CD16 as well as CD11b and distinguished into CD16+CD11b+ cells, CD16+CD11b− cells, CD16−CD11b+ cells, and CD16−CD11b− cells. c) Frequency of CD3+ T cells among CD45+ immune cells was determined. d) CD3+ T cells were distinguished into CD4+, CD8+, and DN T cells and frequency among T cells was determined. e) Shown is the frequency of CD11c+ cells among CD8+ T cells. f) MFI value for PD-1 expression and g) percentage of PD-1+ cells was determined for each T cell population. h) the frequency of B cells was determined for each sample. i) The frequency of cDC2 among all CD45+ immune cells was determined for each sample with more than 50 cDC2 in the final gate (Figure S5C) as well as j) the phenotype based on CD14 expression. a-j) the frequency or MFI value were plotted as scatter plot (one-way ANOVA with Dunnett’s multiple comparison test; *p < 0.05, **p < 0.01, ***p < 0.001, ****p < 0.0001).
Supplemental Material
Download MS Word (12.6 MB)Data availability statement
The data supporting this study are available from the corresponding authors upon reasonable request.