
Figures & data
© 2023 The Author(s). Published with license by Taylor&Francis Group, LLC
Figure 1. Activins are elevated in peripheral blood and tumor microenvironment in tumor bearing mice and cancer patients. (a) peripheral blood samples were collected from healthy mice, pregnant mice, and mice carrying various tumors. Plasma levels of activins were measured by ELISA kits. (b-c) peripheral blood samples were collected from mice at indicated days after MC38 (b), EL4 (c) tumor implantation, and measured for plasma levels of activins using ELISA. (d-f), human plasma levels of activins, were measured by ELISA from samples obtained from healthy donors and cancer patients. Activin a (d), activin B (e) and activin a levels of patients with different stages of non-small cell lung cancer (f) were measured respectively.
Figure 2. RNA expression of activins is detected in tumor cells and immune cells. (a) differential gene expression of the inhibin beta protein subunits – monomers of the dimeric activins – was compared using qRT-PCR. RNA was isolated from B16F10, MC38, and EL4 cell lines as well as healthy C57BL/6J mouse spleens. (b) MC38 tumor-infiltrating lymphocytes were sorted into major immune cell subsets as indicated and tested for the expression of the different activin subunit genes.
Figure 3. Activins promote the development of induced Tregs (iTregs) in vitro and in vivo. (a-b) naive CD4+ T cells were isolated from WT C57BL/6J mice, and then cultured in vitro with plate-bound anti-CD3, soluble anti-CD28, recombinant IL-2 and the indicated gradient concentrations of TGF-b for 3 days. The percentage of CD25highFoxp3+ (a) and Foxp3+Ki67+ (b) in CD4+ cells were analyzed by flow cytometry. (c-d) WT C57BL/6J mice were inoculated with B16F10 tumors and treated with 50ng per mouse recombinant activin A or PBS every other day for 21 days. TILs and specified organs (draining lymph nodes shown as DLN, spleens shown as SP) were harvested from these mice and analyzed for the frequency of CD25highFoxp3+ (c) and Foxp3+Ki67+ (d) in CD4+ cells by flow cytometry. (e) naive CD4+ T cells were isolated from WT C57BL/6J mice, and then stimulated with plate-bound anti-CD3, soluble anti-CD28, recombinant IL-2 in the absence or presence of recombinant activin A. 36 hours later, RNA was analyzed for the expression of indicated genes using qRT-PCR.
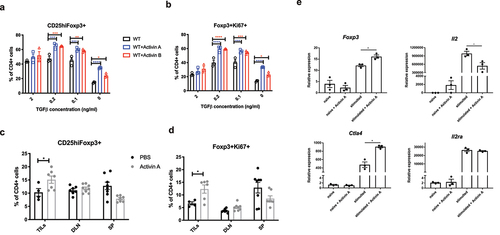
Figure 4. ActRIC and ActRIIB mediate activin signaling in CD4+ cells. (a) healthy spleen cells from Foxp3-YFP reporter mice were sorted into major immune cell subsets. RNA from these samples was tested for the expression of the different activin receptors. (b) naive CD4+ T cells were isolated from WT C57BL/6J mice, and then stimulated with plate-bound anti-CD3, soluble anti-CD28, recombinant IL-2 in the absence or presence of recombinant TGF-b. Cells were collected at indicated time points and analyzed for the mRNA expression of Foxp3 and Acvr1c using qRT-PCR. (c) WT naïve CD4 cells were differentiated under iTregs skewing conditions (plate-bound anti-CD3, anti-CD28, IL2, and TGF- β), and cells were collected at indicated times. RNA from these samples was tested for the expression of the different activin receptor transcripts using qRT-PCR. (d) WT naïve CD4+ cells were differentiated under iTregs skewing conditions before being collected at indicated timepoints for immunoblot analysis.
Figure 5. Activin signaling through ActRIC regulates iTregs differentiation, rather than stability or function. (a) naïve CD4+ T cells were isolated from WT or Acvr1c KO mice and cultured under iTreg conditions in the absence or presence of activins. (b) naïve CD4+ T cells were isolated from WT or Acvr1c KO mice and adoptively transferred to Rag2 KO mice. The animals were monitored for weight loss over the course of disease progression. (c) the induction of Foxp3 in different organs was analyzed by flow cytometry. (d, e) naïve CD4+ cells were isolated from WT or Acvr1c KO mice bearing Foxp3-GFP reporter and cultured under iTreg condition. The induced Tregs were sorted using the Foxp3-GFP reporter, and then cocultured with the cell Trace Violet-labeled naïve CD4+ cells at indicated ratios. Proliferation of the T conventional cells was observed three days later. The results are summarized in (d), and individual plots are shown in (e). (f, g) Treg cells (CD45.2) from WT or Acvr1c KO animals were adoptively transferred with naïve CD45.1+ CD4+ cells into Rag KO animals. The recipients’ weight was monitored for 8 weeks (F), after which the indicated organs were harvested for flow cytometry analysis to determine the number of CD45.1+ cells (G). (h) iTregs generated under in vitro skewing conditions and sorted by the Foxp3-GFP reporter were adoptively transferred into TCRα KO animals. One week later, the expression frequencies of Foxp3, helios, and Eomes were quantified using flow cytometry.
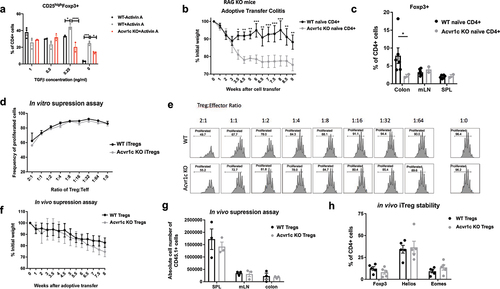
Figure 6. Tumor growth was inhibited in Acvr1c KO mice. (a) results of one representative experiment of MC38 tumor growth in WT vs. Acvr1c KO mice. Global Acvr1c KO and WT female mice were challenged subcutaneously with 250,000 MC38 tumor cells. Disease progression was monitored over time by measuring the tumor size using caliper. The tumors were excised 23 days post-injection and weighed. (b) survival analysis of WT vs. Acvr1c KO mice with MC38 tumors. (c) TCRα KO mice were reconstituted with WT CD8+ cells and WT or Acvr1c KO naïve CD4+ cells 1 week prior to MC38 tumor challenge. Tumor size was monitored over time. (d-k) the tumor infiltrating lymphocytes (TILs) extracted from the tumors, together with the cells processed from the draining lymph nodes and spleens, were analyzed for the frequency of indicated markers by flow cytometry. The percentage of CD25highFoxp3+ (D), Foxp3+Ki67+(E), CD25highGITR+(F) and CD25highAcvr1c+ (G) cells were analyzed in WT v.S. Acvr1c KO CD4+ cells. The production of TNFα and IFN-γ by CD4+ cells (H, I) or CD8+ cells (J, K) were also measured by intracellular cytokine staining.
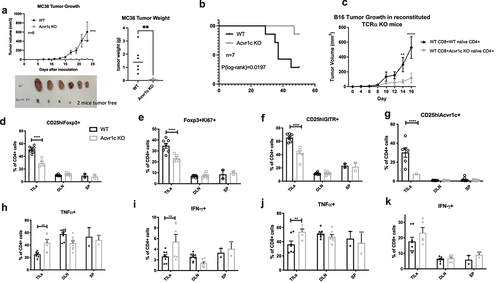
Figure 7. Monoclonal antibodies targeting ActRIC were generated and showed therapeutic effects in treating mouse tumors. (a) 293 T cells were transfected with plasmids encoding for empty vector, activin A, activin receptor 1c (ActRIC) or activin receptor 2b(ActRIIB). After rest for a day, the transfected 293T cells were collected and stained by using the two clones of monoclonal antibody targeting ActRIC as the primary antibody and a fluorescence conjugated anti-mouse IgG1 antibody as the secondary antibody. (b) naïve CD4+ T cells were isolated from WT or Acvr1c KO mice and cultured under iTreg conditions in the absence or presence of activins as described previously. The two clones of monoclonal antibodies were tested for their blocking efficiency. (C) WT C57/BL6J mice were inoculated with B16F10 tumor cells subcutaneously at 40,000 cells/mouse. 6 days later, the i.P. treatment with indicated antibodies started when the tumors became palpable. Tumor growth kinetics are graphed. 24 days post the inoculation, the tumors were excised, weighed and imaged. (d) the frequency of IFN-γ producing CD8 cells in TILs, DLN, and spleens harvested from the treated mice with B16 tumors was analyzed by flow cytometry.
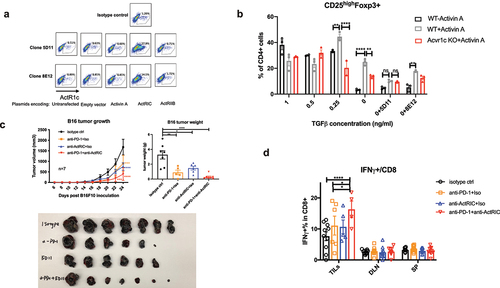
Figure 8. Graphical abstract describes the ability of activins to promote FOXP3 induction through ActRIC in cancer. Created with BioRender.com.
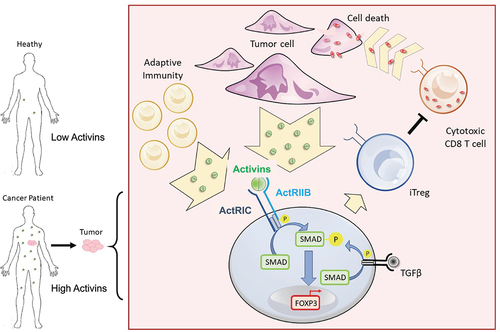
Figure S1.eps
Download EPS Image (1.3 MB)Figure S4.eps
Download EPS Image (7.9 MB)Supplementary Tables YingZheng.docx
Download MS Word (34.5 KB)Figure S2.eps
Download EPS Image (1.3 MB)Figure S5.eps
Download EPS Image (1,009.7 KB)Figure S3.eps
Download EPS Image (3.2 MB)Data availability statement
The authors confirm that the data supporting the findings of this study are available in the article and its supplementary materials. Raw data generated at the Bloomberg~Kimmel Institute for Cancer Immunotherapy, Johns Hopkins University School of Medicine, are available from the corresponding author Y.Z. and D.P. on request.