
Figures & data
Figure 1. Effects of IL-37 on NK cell-effector functions.
(a) Cytotoxic activity of IL-15- (black circles) or IL-15 plus IL-37-treated (gray circles) NK cells following co-culture with the indicated cancer cell lines at different effector (E): target (T) ratios. Data are plotted as percent of cytotoxicity of independent experiments performed on at least four HD.
(b) CD69 expression of IL-15- (black column) or IL-15 plus IL-37-treated (gray column) NK cells for 18 h. Data are plotted as mean fluorescent intensity (MFI) of three independent experiments performed on live NK Cells (56+ DAPI -).
(c-d) Interferon γ (IFN-γ) and Granulocyte-macrophage colony-stimulating factor (GM-CSF) production of IL-15- (black column) or IL-15 plus IL-37-treated (gray column) NK cells following co-culture with K562 cells at 0.5:1 E:T ratios.
Mean values (pg/ml) ± SEM are reported. Statistical analysis has been performed using paired t-test. *p < 0.05, ***p < 0.005.
Figure 2. Effects of IL-37 on IL-1R8 expression and GSK3β phosphorylation.
(a) Western Blot analysis and quantification of phosphorylated and total ERK (left panel) and NF-kB (p65, right panel) of IL-15- or IL-15 plus IL-37- treated NK cells for 18 h. Representative blots from one out of four independent experiments (upper panel). The results have been normalized over vinculin. Mean values ± SEM are reported. Statistical analysis has been performed using paired t-test and ratio paired t-test. *p < 0.05 (b) Confocal microscopy Imaging of IL-1R8 expression of IL-15- or IL-15 plus IL-37- treated NK cells for 18 h. A representative image is reported from seven independent experiments (left panel). Blue: nuclei (Hoechst 33,342); red: IL1R8. Scale bars 2.5 µm. IL-1R8 protein quantification is reported in the right panel. Mean values (fold changes) ± SEM are reported. Statistical analysis has been performed using ratio paired t-tests. *p < 0.05
(c) Western Blot analysis of IL-1R8 in IL-15- or IL-15 plus IL-37-treated NK cells for 18 h. A representative blot is reported from four independent experiments (upper panel). IL-1R8 protein quantification is reported in the lower panel. The results have been normalized over vinculin. Values are mean ± SEM. Statistical analysis has been performed using paired t-tests. *p < 0.05
(d) Western Blot analysis of phosphorylated and total GSK 3β in IL-15- or IL-15 plus IL-37- treated NK cells. A representative blot is reported from four independent experiments (upper panel). GSK3β protein quantification is reported in the lower panel. The results have been normalized over vinculin. Mean values (pg/ml) ± SEM are reported. Statistical analysis has been performed using paired t test. *p < 0.05
(e) Western Blot analysis of IL-1R8 in IL-15- or IL-15 plus IL-37-treated NK cells with TWS119 (20 μM) or DMSO for 18 h. IL-1R8 protein quantification is reported in the lower panel. The results have been normalized over vinculin. Values are mean ± SEM. Statistical analysis has been performed using ratio paired t-tests. *p < 0.05
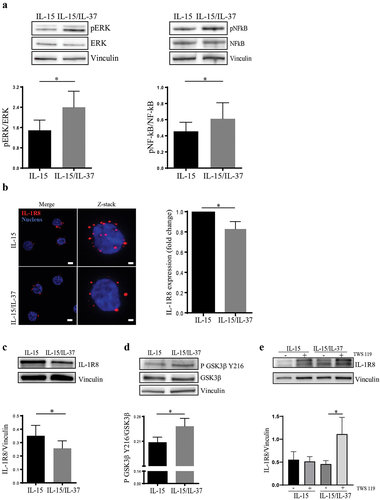
Figure 3. Effects of IL-37 on IL-1R8 silenced NK cells cytotoxicity.
(a–c) Cytotoxic activity of IL-15- (black circles), IL-15 plus IL-37-treated (gray open circles) IL-1R8-silenced NK cells and IL-15- (red circles), IL-15 plus IL-37-treated (gray circles) mock NK cells following co-culture with K562 (a), IMR-32 (b) and COLO-205 (c) cells at different effector (E): target (T) ratios. Data are plotted as a percentage of cytotoxicity of independent experiments performed on at least four HD. Statistical analysis has been performed using paired t-test. *p < 0.05
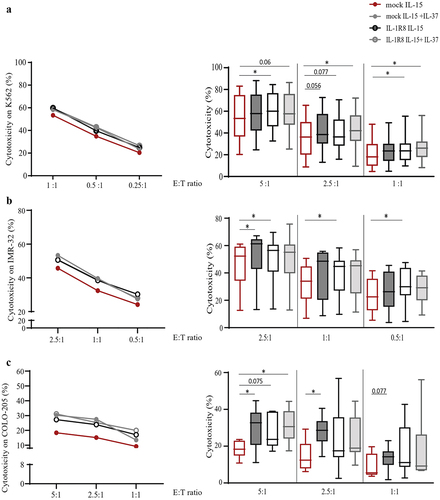
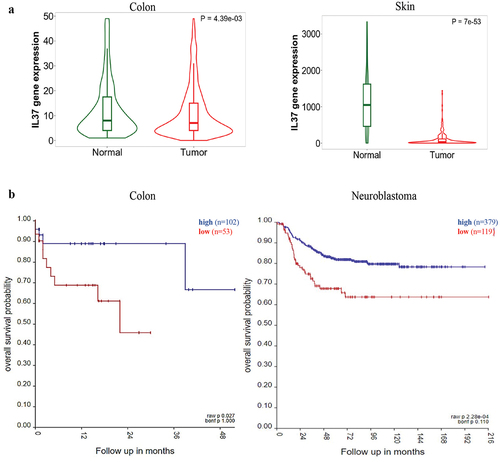
Figure 4. IL-37 gene expression on cancer patients and overall survival.
(a) Differential gene expression analysis of IL-37 gene in colon cancer (n = 1450) and in healthy tissues (n = 377) (left panel) and in skin cancer (n = 253) and in healthy tissues (n = 174) (right panel) from gene chip public databases. Analyses were performed by the TNM plot web tool22 Statistical analyses have been performed using the Mann-Whitney U test. p = 4.39e-03 (colon) and p = 7E-53 (skin)
(b) Kaplan–Meier curve of overall survival (OS) in colon adenocarcinoma (left panel) and neuroblastoma (right panel) patients categorized on IL-37 gene expression. The analysis was generated by R2: Genomics Analysis and Visualization Platform (http://r2.amc.nl) using the dataset TCGA – 174 – custom – agg4502a073 (n = 155) (n = 155; high IL-37 n = 102; low IL-37 n = 53 raw p-value = 0.027) and tumor neuroblastoma – SEQC - 498 - custom – ag44kcwolf (n = 498; raw p-value = 2.28 × 10⁻⁴).
Supplemental material