Figures & data
Figure 1. Changes in the cell surface proteome during monocyte-to-MDSC differentiation show the upregulation of vesicle-related pathways. (a) Monocytes were differentiated to CAF-MDSC and subjected to label-free proteomics. (b) Differential protein expression analysis of cell surface proteins in CAF-MDSCs vs. monocytes; cell surface proteins were filtered based on gene ontology cellular component (GOCC) terms ‘plasma membrane’ and ‘extracellular space’; colored dots represent significantly altered proteins (red = up; blue = down) (c) Enriched pathway and process terms based on differentially expressed proteins in CAF-MDSC using metascape.
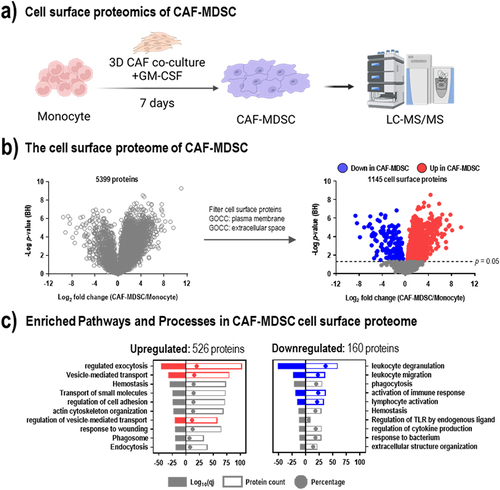
Figure 2. The cell surface proteome of CAF-MDSC is enriched in proteins. (a) Monocytes were differentiated to cancer-associated fibroblast-induced myeloid derived suppressor cells (CAF-MDSC), immature dendritic cells (iDC), M1 and M2 macrophage and subjected to label-free proteomics. (b) Principal component analysis of the cell surface proteome profile of monocytes and differentiated cells – CAF-MDSC, iDC, M1 and M2 macrophage. (c) Differential protein expression analysis of cell surface proteins in CAF-MDSC vs. iDC or M1 or M2 macrophage; cell surface proteins were filtered based on GOCC terms ‘plasma membrane’ and ‘extracellular space’; significantly enriched cell surface proteins in CAF-MDSC (fold change > 2; FDR < 0.05) are enclosed in red box (dotted line on x-axis: Log2 = 1.0; y-axis: p-value (BH) = 0.05). (c) Overlap of significantly enriched cell surface proteins in CAF-MDSC vs. other cell types. (d) Gene ontology enrichment of significantly enriched cell surface proteins in CAF-MDSC (44 proteins) using STRING DB.
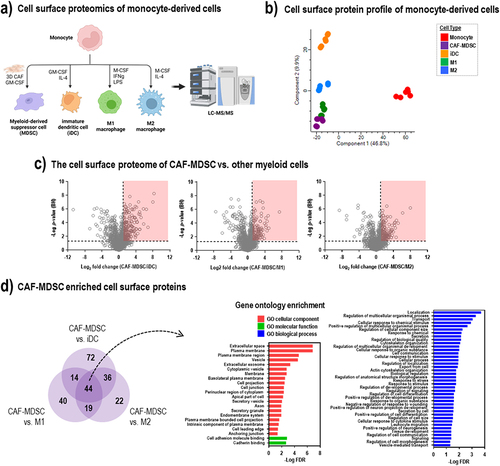
Figure 3. Suppression of autologous CD8 T-cell proliferation by CAF-MDSC extracellular vesicles (EV). Autologous CD8 T-cell were co-cultured with CAF-MDSC and treated with nSmase2 inhibitor (b) or treated with EVs (e-f) for 3 days then T-cell proliferation was measured by CFSE dilution using flow cytometry. (a) EVs released by CAF-MDSC can potentially suppress T-cell proliferation; this effect could be reversed by inhibiting the enzyme neutral sphingomyelinase 2 (nSmase2) that is important in EV generation. (b) Co-cultures of CAF-MDSCs and autologous CD8 T-cells were treated with an nSmase2 inhibitor (nSmase2i) or its inactive form. (c-d) EV characterization by nanoparticle tracking analysis to measure particle size and number. (e) Suppression of autologous CD8 T-cell proliferation by EVs released by CAF-MDSC using 6.25, 12.5, 25, 50, 100 µg EV or (f) 100 µg EVs isolated from myeloid cells based on protein content. Data shown is mean ± SEM from three independent experiments. Multiple group comparison by one-way ANOVA; ****= p < 0.001, ***= p < 0.001, **= p < 0.01 *= p < 0.05, ns = not significant.
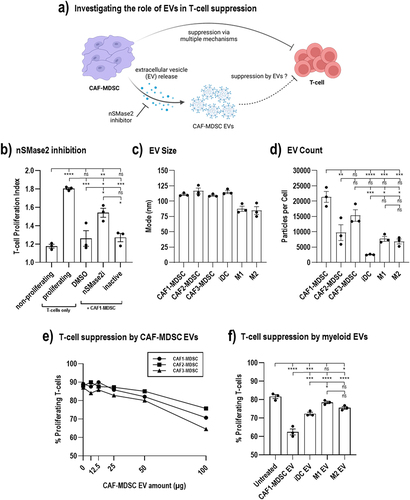
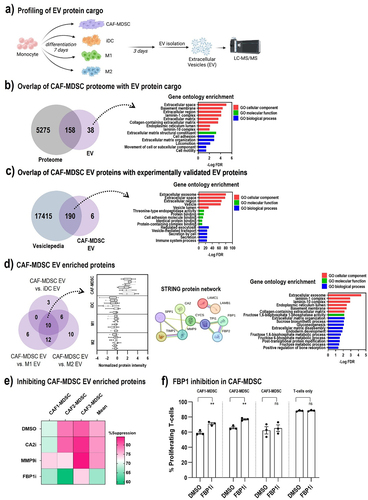
Figure 4. CAF-MDSC extracellular vesicle protein cargo. (a) Proteins contained in EVs isolated from monocyte-derived cells were quantified by TMT-based LC-MS/MS. (b) Overlap of CAF-MDSC EV proteins with CAF-MDSC proteome and gene ontology enrichment of proteins uniquely identified in the EV. (c) Overlap of CAF-MDSC EV proteins with experimentally validated EV proteins in the vesiclepedia database (http://microvesicles.org/) and gene ontology enrichment of CAF-MDSC EV proteins. (d) Venn diagram showing the overlap of significantly enriched proteins in CAF-MDSC EV vs. iDC EV or M1 EV or M2 EV; box plot of the normalized intensity of the 10 enriched proteins, each box represents one replicate in the LC-Ms/MS analysis; functional protein network analysis and gene ontology enrichment of the 10 proteins using STRING DB. (e) CAF-MDSC/T-cell coculture were treated with inhibitors of CA2 (0.01 µM), MMP9 (0.1 µM), and FBP1 (10 µM) then T-cell proliferation was measured by CFSE dilution assay. The percentage of suppression was calculated using the established formula: ((Log2(y) of teff alone – Log2(y) of Teff+Myeloid cells)/Log2(y) of teff alone) x 100, where y is the mean fluorescence intensity (MFI) of CFSE on the whole population divided by the MFI of CFSE of non-proliferating cells.Citation16 (f) effect of FBP1 inhibition in CAF-MDSC on T-cell proliferation. Data shown is mean ± SEM from three independent experiments. Multiple group comparison by one-way ANOVA; **= p < 0.01, *= p < 0.05, ns = not significant.