Figures & data
Figure 1. Hub gene selection. (a) genes associated with chromatin and favorable prognosis in GC from the ACRG and TCGA cohorts. (b) CHAF1A and UHRF1 were identified as the highest linkage hub genes in the protein-protein interaction analysis. (c) overall survival (OS) analysis for CHAF1A in GC from the ACRG, TCGA, GSE15459, and GSE57303 cohorts. (d) OS and disease-free survival analysis for CHAF1A in the AHJU cohort. GC: gastric cancer; ACRG: Asian cancer Research Group; AHJU: Affiliated Hospital of Jiangsu University; TCGA: the cancer genome atlas.
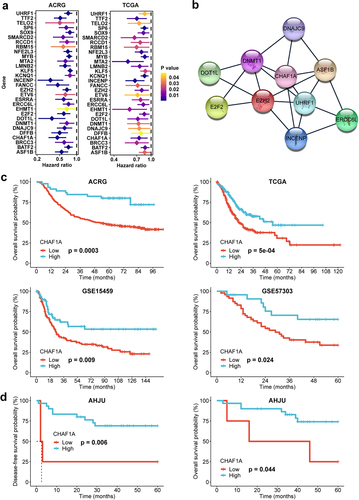
Figure 2. CHAF1A expression and immune biomarkers. (a) CHAF1A mRNA expression by MSI status. (b) correlation of CHAF1A mRNA expression with tumor mutation burden (TMB). (c) correlation between mRNA expressions of CHAF1A and immune effector genes. (d) PD-L1 combined positive score by CHAF1A expression in the NCT#02589496 cohort. (e) typical micrograph of CHAF1A IHC staining in tumors, at 200×magnification. (f) IHC score of CHAF1A by MSI status. (g) correlation between TMB and CHAF1A IHC score. (h) correlation between CHAF1A IHC score and the mRNA expression of immune effector genes. GC: gastric cancer; MSI: microsatellite instability; MSS: microsatellite stability; IHC: immunohistochemistry; ACRG: Asian cancer Research Group; AHJU: Affiliated Hospital of Jiangsu University; TCGA: the cancer genome atlas.
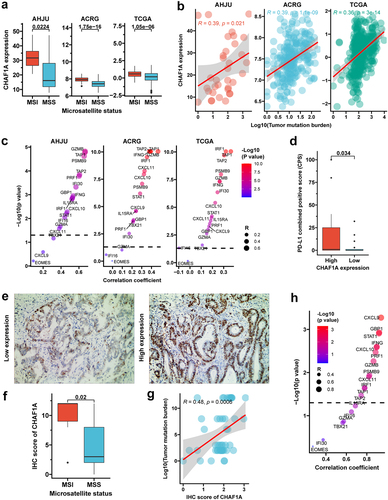
Figure 3. CHAF1A expression and immune infiltration. (a) CHAF1A mRNA expression in GC by immune phenotype in TCGA. (b) correlation of CHAF1A mRNA expression with the abundance of infiltrating immune cells. (c) typically microscopic image of surface biomarkers of immune cells by multiplexed immunohistochemistry staining in AHJU. 1: CD8; 2: CD56; 3: CD68 (green) and HLA-DR (red); 4: the reconstructed image for all surface biomarkers. (d) correlation of CHAF1A mRNA expression with the densities of immune cells in the tumor parenchyma. (e) correlation of CHAF1A mRNA expression with the effective infiltration score of immune cells. GC: gastric cancer; ACRG: Asian cancer Research Group; AHJU: Affiliated Hospital of Jiangsu University; TCGA: the cancer genome atlas.
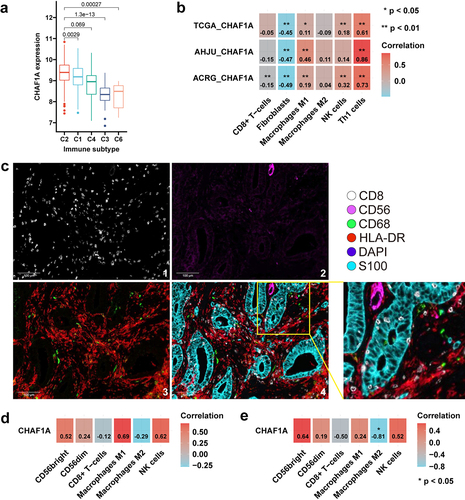
Figure 4. CHAF1A expression and immunotherapy outcome. (a) CHAF1A mRNA expression by response status in the NCT#02589496 cohort. (b) the ROC curve for response prediction by CHAF1A mRNA expression. (c) objective response rate (ORR) by CHAF1A expression level. (d) the IHC score of CHAF1A protein by response in the AHJU immunotherapy cohort. (e) the ROC curve for response prediction by CHAF1A IHC score. (f) ORR by CHAF1A protein expression. (g,h) progression-free survival (g) and overall survival (h) by CHAF1A protein expression. (i) CHAF1A mRNA expression by response status in the IMvigor210 cohort. (j) the ROC curve for response prediction by CHAF1A mRNA expression. (k) objective response rate by CHAF1A expression level. (l) overall survival by CHAF1A expression level. GC: gastric cancer; IHC: Immunohistochemistry; AHJU: Affiliated Hospital of Jiangsu University; ROC: receiver operating characteristic curve; AUC: the areas under the ROC curves. HR: hazard ratio; CI:confidence interval.
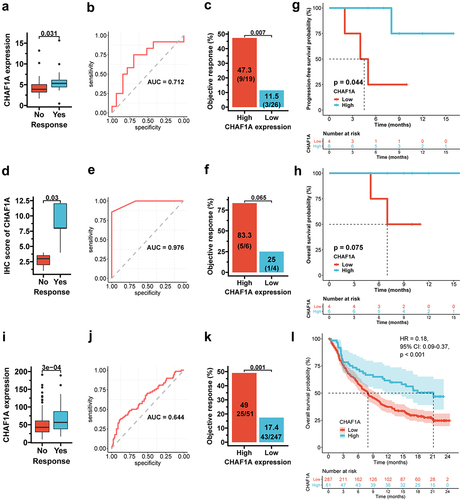
Table 1. Immunotherapy response by CHAF1A mRNA expression.
Figure 5. CHAF1A knockdown and anti-PD-1 effect. (a) CHAF1A knockdown in B16F10 cells. (b) tumors in vivo on the 20th day after subcutaneous injection of B16F10 cells treated by vehicle and shCHAF1A into C57bl/6 mice. (c,d) The inhibited effects of anti-PD-1 antibody on tumor growth and the tumor growth curves in the vehicle (c) and shCHAF1A (d) groups, respectively. (e) tumor volume reduction induced by anti-PD-1 antibody between the vehicle and shCHAF1A groups. (f) The relative tumor proliferation rate T/C. (g) survival curves of mice in the vehicle and shCHAF1A groups, respectively.
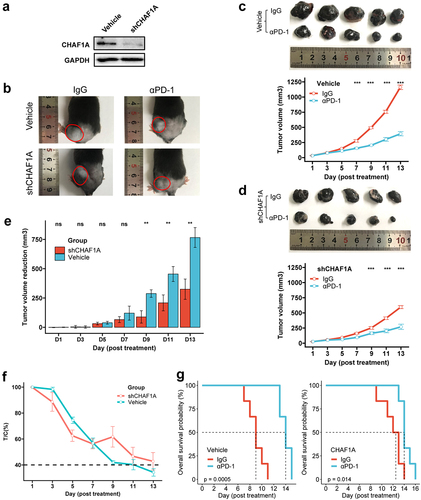
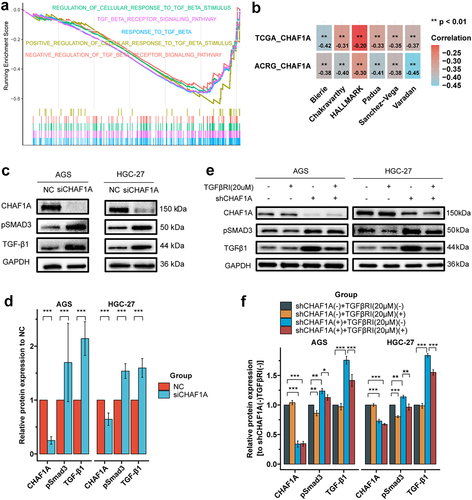
Figure 6. CHAF1A expression and TGF-β signaling. (a) Gene set enrichment analysis by CHAF1A expression levels indicated that signaling associated with TGF-β were down-regulated in the high expression group. (b) correlation of CHAF1A mRNA expression with TGF-β scores (signature authors are shown) based on transcriptome. (c) CHAF1A siRNA (siCHAF1A) up-regulates the expressions of TGF-β1 and phosphorylated SMAD3 (pSMAD3). (d) quantization of grayscale values in figure C. (e) the TGF-β receptor inhibitor (TGFβRI) SB-431542 inhibits the up-regulation of TGF-β1 and pSMAD3 by CHAF1A shRNA (shCHAF1A). (f) quantization of grayscale values in figure e. ACRG: Asian Cancer Research Group; TCGA: the Cancer genome atlas.