
Figures & data
Figure 1. Activation markers in MAIT cells. Circulating MAIT cells were collected before and after the first treatment cycle with ICB and analyzed by flow cytometry for their expression of Ki67 (a), HLA-DR (b), CD38 (c), and co-expression of HLA-DR and CD38 (d). Left-hand graphs show all patients, and the right-hand graphs show patients grouped by treatment outcome. Symbols represent individual values. Bright green circles represent patients receiving ICB as their only treatment and dark green circles patients receiving ICB together with or after chemotherapy. Dot-plots show the expression of Ki67 and HLA-DR vs CD38 in MAIT cells gated as in Supplementary Figure S1 before and after the first treatment cycle. *p< .05, n=10–14.
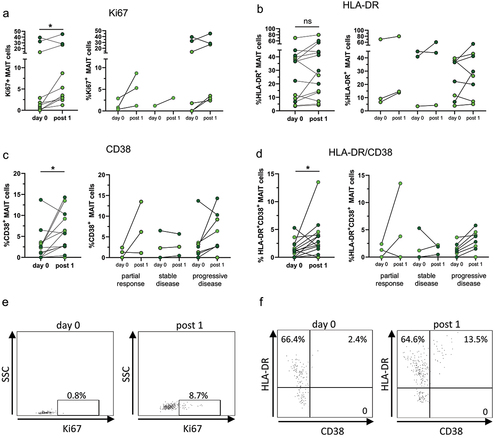
Figure 2. Cytokine production by MAIT cells. Circulating MAIT cells were collected before and after the first treatment cycle with ICB, activated by treatment with PMA and Ionomycin and analyzed by flow cytometry for their production of TNF (a), IL-2 (b), IFN-γ (c), and GrB (d). Left-hand graphs show all patients, and the right-hand graphs show patients grouped by treatment outcome. Symbols represent individual values. Bright green circles represent patients receiving ICB as their only treatment and dark green circles patients receiving ICB together with chemotherapy. Dot-plots show the expression of IL-2 vs TNF (e) and GrB vs IFN-γ (f) in MAIT cells gated as in Supplementary Figure S1 before and after the first treatment cycle. *p < .05, n=9.
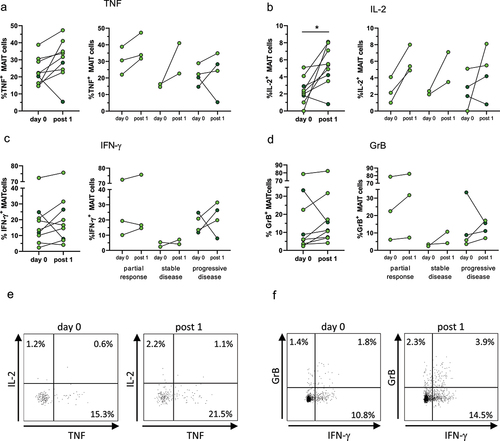
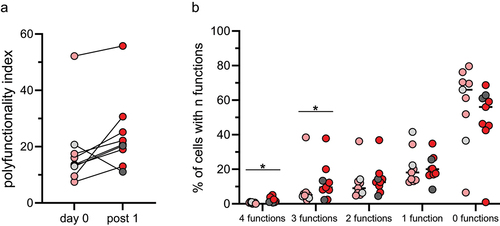
Figure 3. Polyfunctionality in MAIT cells. Circulating MAIT cells were collected before and after the first treatment cycle with ICB and analyzed by flow cytometry for their production of TNF, IL-2, IFN-γ, and GrB. (a) Polyfunctionality index before and after the first treatment cycle. (b) Percentage of cells with 4, 3, 2, 1, or 0 functions before (pink and light grey circles) and after (red and dark grey circles) the first treatment cycle. Symbols represent individual values and the lines the median. Pink and red circles represent patients receiving ICB as their only treatment and light and dark grey circles patients receiving ICB together with chemotherapy. *p < .05, n=9.
Suppl material 240112.docx
Download MS Word (930.8 KB)Data availability statement
The authors confirm that the data supporting the findings of this study are available within the article and its supplementary materials.