
Figures & data
Figure 1. Identification, isolation and expansion of CD8+ Arg1-specific T cell clones. (a) CD4+ and CD8+ Arg1-specific T-cell responses in in vitro cultured HD 117 PBMCs after stimulation with ArgLong2 peptide compared to non-stimulated control. (b) Expanded ArgLong2-specific T-cell culture from HD 117 with CD4+ and CD8+ T cells. (c) Expanded CD8+ ArgLong2-specific T cell clones #18, #20 and #23 and CD8+ control T cell clone. (a-c) the specificity of each culture as assessed by CD107α staining (CD8+ T cells) (right) and intracellular staining (ICS) for IFNγ and TNFα (left). (a-b, top) flow cytometry dot-plots of IFNγ+, TNFα+ and IFNγ+/TNFα+ CD4+ and CD8+ ArgLong2-specific T-cell responses. (a-b, bottom) stacked bar charts of CD107α+, IFNγ+, TNFα+ and IFNγ+/TNFα+ CD4+ and CD8+ ArgLong2-specific T-cell responses or (c) CD8+ ArgLong2-specific T cell clones. (d) Reactivity of CD8+ control T cell clone to ArgLong2 peptide or ConA (pos ctrl) stimulation compared to no stimulation (T cells alone) determined in an IFNγ Elispot assay. Representative Elispot wells of responses against non-stimulated cells, ArgLong2-peptide or ConA stimulated cells. Too numerous to count, > 500 IFNγ spots (TNTC).
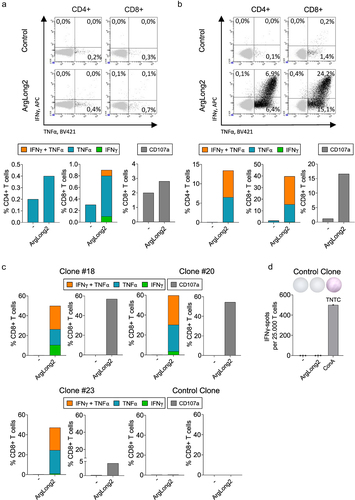
Figure 2. CD8+ Arg1-specific T cells target malignant myeloid cells in an Arg1-expression-dependent manner. (a) 51Chromium-release assay of CD8+ Arg1-specific T cell clone #20 (left) or CD8+ control T cell clone (right) against MonoMac-1 cells ± IL-13 (20 U/mL, 48 h) in technical duplicates. 7.5 × 10⁴ effector cells at E:T ratio of 15:1. Error bars represent mean ± SD. (b) Arg1 expression in MonoMac-1 ± IL-13 (20 U/mL, 48 h) evaluated by RT-qPCR analysis. (b, h) Arg1 expression was measured relative to large ribosomal protein (RPLPO) expression in technical triplicates. (c) Bar charts (left) and histogram plots (right) of flow cytometry determined relative MFI values for HLA ABC expression in MonoMac-1 cells treated with IL-13 (20 U/mL, 48 h) (green) compared to untreated MonoMac-1 cells (grey) in biological duplicates. (d) IFNγ Elispot responses of Arg1-specific T cell clone #20 and #23 to Arg1 mRNA or mock transfected MonoMac-1 cells. E:T ratio of 1:1. Representative Elispot wells of responses against (d) Arg1 mRNA or mock or (f-g) Arg1 siRNA or mock transfected MonoMac-1 cells. (e) Bar charts (left) and histogram plots (center) of flow cytometry determined MFI values for Arg1 expression in MonoMac-1 cells and bar charts (right) of the frequency of Arg1+ cells among total live MonoMac-1 cells, 24 h after mock (light grey) or Arg1 mRNA (blue) transfection. Isotype ctrl of mock transfected cells shown in dark grey. (f) IFNγ Elispot responses of Arg1-specific T cell clone #18 (green background) and CD8+ control T cell clone (purple background) to Arg1 siRNA or mock transfected MonoMac-1 cells treated with IL-13 (20 U/mL, 48 h). E:T ratio of 2:1. (g) Granzyme B (GzmB) and perforin (Prf1) Elispot responses of Arg1-specific T cell clone #18 to Arg1 siRNA or mock transfected MonoMac-1 cells treated with IL-13 (20 U/mL, 48 h). E:T ratio of 2:1. (h) RT-qPCR analysis of Arg1 expression in MonoMac-1 after mock or Arg1 siRNA transfection ± IL-13 (20 U/mL, 48 h). Not detected (ND). *p ≤ .05. All bars represent the mean values ± SD.
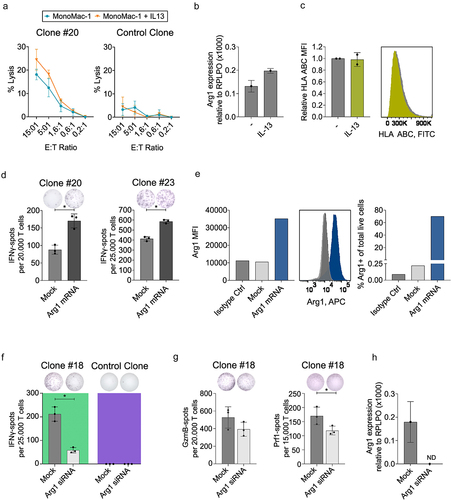
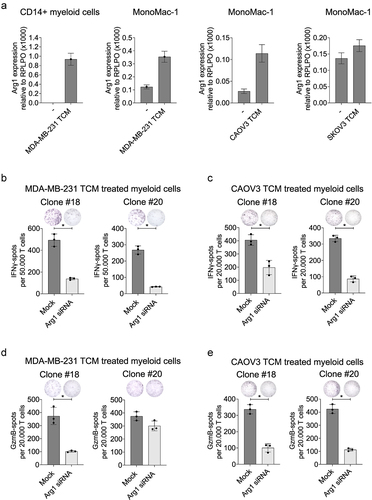
Figure 3. CD8+ Arg1-specific T cells target autologous myeloid cells in an Arg1-expression-dependent manner. (a) Arg1 expression in CD14+ monocytes from a random healthy donor ± MDA-MB-231 TCM treatment (1 mL, 48 hrs) and MonoMac-1 ± MDA-MB-231 TCM, CAOV3 TCM or SKOV3 TCM treatment (1 mL, 48 hrs) evaluated by RT-qPCR analysis. Arg1 expression was measured relative to large ribosomal protein (RPLPO) expression in technical triplicates. (b-e) Responses of Arg1-specific T cell clone #18 and #20 to (b,d) MDA-MB-231 TCM treated or (c,e) CAOV3 TCM treated Arg1 siRNA or mock transfected autologous CD14+ cells as assessed in (b-c) IFNγ Elispot and (d-e) Granzyme B (GzmB) Elispot. E:T ratio of (b,d) 2:1 and (c,e) 4:1. Representative Elispot wells of responses against Arg1 siRNA or mock transfected autologous CD14+ cells. *p ≤ .05. All bars represent the mean values ± SD.
SupplementaryFigure1Revised.jpg
Download JPEG Image (647.1 KB)
Data availability statement
The data that support the findings of this study are available from the corresponding author, MHA, upon reasonable request.