
Figures & data
Table 1. Clinical and pathologic characteristics of pancreatic ductal adenocarcinoma cases according to patient cohort.
Figure 1. TCR Repertoire Diversity Metrics in the WashU Cohort. A-C: comparison of matched tissue and PBMC samples (n = 108) by (a) True entropy, (b) Shannon Weiner index, (c) Inverse Simpson index. D-F: comparison of survival groups in tissue samples by (d) True entropy, (e) Shannon Weiner index, (f) Inverse Simpson index (D: LT n = 27, MT n = 39, ST n = 15; E/F: LT n = 26, MT n = 33, ST n = 15). G-I: comparison of survival groups in PBMC samples by (g) True entropy, (h) Shannon Weiner index, (i) Inverse Simpson index (LT n = 37, MT n = 47, ST n = 24).
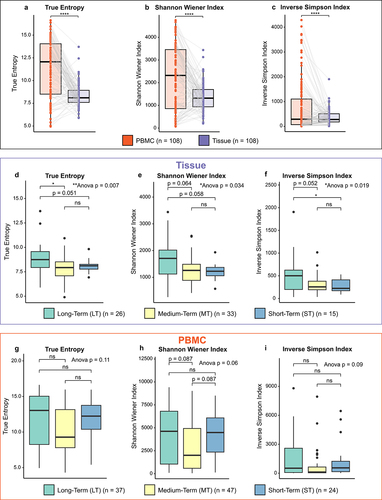
Figure 2. Multivariate cox proportional-hazards models for the UW and WashU – tissue, WashU – PBMC and TCGA – tissue cohorts. (a,b) Multivariate cox proportional-hazards model for UW and Wash U – tissue cohort (N = 167), using the variables: age, nodal status, neoadjuvant therapy, TCR diversity (true entropy) quartile group and fraction T-cell group. Impact of upper quartile compared to lower 3 quartile TCR diversity (a) and impact of above median compared to below median fraction T-cells (b) on overall survival. (c,d) Multivariate cox proportional-hazards model for Wash U-PBMC cohort (N = 152), using the variables: age, nodal status, neoadjuvant therapy, TCR diversity (true entropy) quartile group and fraction T-cell group. Impact of upper quartile compared to lower 3 quartile TCR diversity (c) and impact of above median compared to below median fraction T-cells (d) on overall survival. (e) Multivariate cox proportional-hazards model for TCGA-Tissue cohort (N = 150), using the variables: age, nodal status, and TCR diversity (true entropy) quartile group. Impact of upper quartile compared to lower 3 quartile TCR diversity (e) on overall survival. F: hazard ratios for variables in the three models with 95% confidence intervals calculated with multivariate cox regression.
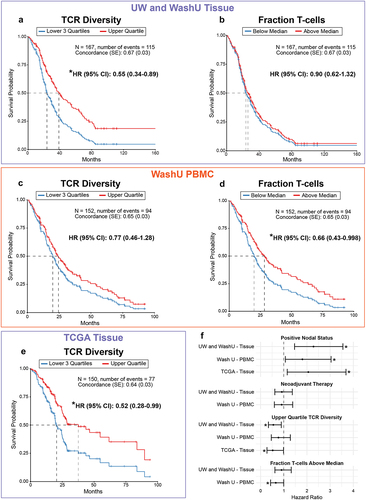
Figure 3. Clustering of WashU tissue patients by shared TCR specificity. (a) Unsupervised clustering of WashU tissue patients into four distinct patient clusters. (b) Kaplan-Meier curve of overall survival by individual cluster. (c) Kaplan-Meier curve of overall survival comparing cluster 3 to pooled clusters 1,2 and 4. D-E: comparison of patient clusters by (d) TCR diversity and (e) estimated T-cell fraction. F: relative abundance of TCR Metaclusters in patient cluster 3 compared to pooled clusters 1,2 and 4.
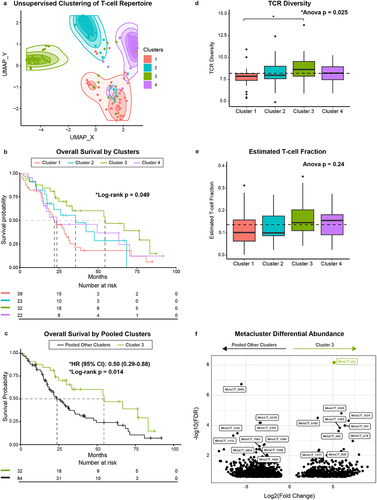
Figure 4. Clustering of WashU tissue TCRs based on amino acid properties (TESSA). A-B: UMAP dimensional reduction of TESSA embedding on all tissue CDR3b sequences from the WashU tissue data set with TCRs unassigned to a cluster removed (a) and with CDR3b sequences belonging to cohort 3 enriched metaclusters highlighted (b). (c) Highlighted TCRs in (b) belonging to a given metacluster within the same TESSA subset were collapsed into vertices and those belonging to a matched metacluster in different TESSA subsets were connected by gray lines (vertex size corresponds to TCR count). TCRs not present in metaclusters enriched in patient cluster 3 (highlighted in b) are excluded from this panel and subsequent analysis. (d) Metaclusters from (b) and (c) were separated based on TESSA subset and tested as a correlate of overall survival in the WashU tissue cohort. (e) Kaplan-Meier curve of overall survival comparing patients with high frequency of TESSA 12 metaclusters (above median) vs. low frequency (below median) in the WashU PBMC cohort. (f) Kaplan-Meier curve of overall survival comparing patients with high frequency of TESSA 12 metaclusters (upper quartile) vs. patients with low frequency (lower 3 quartiles) in the UW tissue cohort as determined by TCR distances.
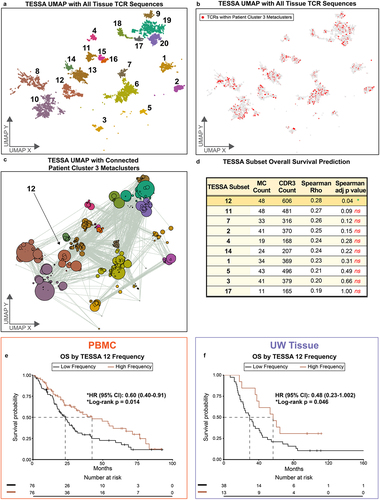
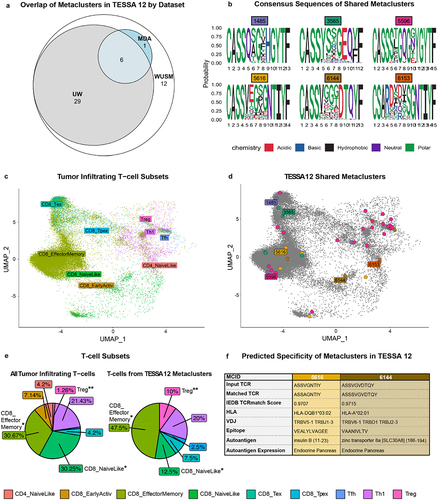
Figure 5. T-cell identity and TCR specificity in metaclusters of interest. (a) Euler plot depicting overlap of TESSA 12 metaclusters between patient cohorts. (b) consensus amino acid sequence of metaclusters shared by WashU tissue, UW tissue and MDA. (c,d) Inference of T-cell identities in MDA dataset based on mapping of scRNA-seq transcriptomes to a reference dataset (c) with T-cells bearing TCRs from TESSA 12 metaclusters highlighted (d). (e) Comparison of T-cell subset frequencies in all tumor-infiltrating T-cells (left, n = 7 patients) and T-cells from TESSA 12 metaclusters (right). (f) predicted specificity of two of the six shared metaclusters from (a) determined with TCRmatch and the IEDB database with a significance cutoff of 0.97.
240109_TCR_PDAC_Supplemental_Figures_OI_Revision.docx
Download MS Word (1.9 MB)Data availability statement
All software packages in this study are publicly available. All code used to generate figures is available at this location (https://github.com/WashU-TCR-PDAC), and de-identified patient data can be made available upon request. TCRb CDR3 sequences will be made publicly available on Adaptive Technologies Immunoseq Analyzer Portal.