
Figures & data
Table 1. Clinical and immunological parameters.
Figure 1. Mutational profiling of myeloid neoplasms (MN). the mutational profile of MDS, CMML and sAML samples was analyzed by targeted NGS. The samples are grouped by diagnosis made in comparison with clinical, genetic and histopathological features regarding the WHO classification of tumors of hematopoietic and lymphoid tissues, 4th and 5th edition. The detected pathogenic mutations are marked with black rectangles, variants of uncertain significance (VUS) with blue rectangles (nomenclature was given according to the recommendations of the Human Genome Variation Society). The age and sex of patients are marked with colored rectangles and the frequency of the respective mutated genes are shown at the right side of the graph.
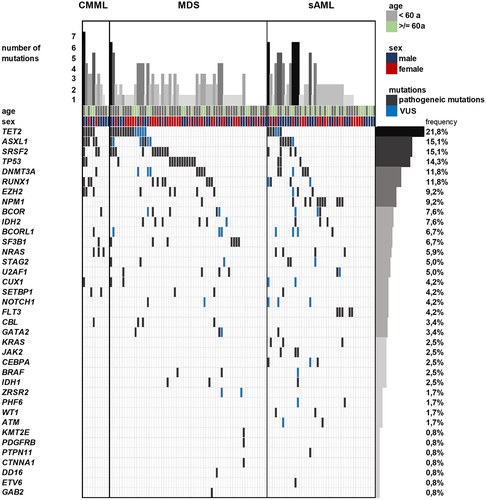
Figure 2. Distinct composition of the bone marrow microenvironment in myeloid neoplasm. Representative pictures of a multiplex IHC (a) of bone marrow (BM) from a patient with MDS with multi-lineage dysplasia (MLD) without excess of blast (EB-0) with a mutation in SRSF2. The amount and the composition of tissue infiltrating lymphocytes (TILs) was analyzed by MSI with a six-color Ab panel directed against CD34 (red), CD3 (yellow), CD8 (magenta), FoxP3 (cyan), MUM1p (orange), GrB (green) and counterstained with DAPI (blue). Pictures with a higher magnification of single markers combined with DAPI are shown at the right side of the picture. Consecutive slides were stained with Abs directed against PD-L1, PD-L2, gal-9, TIM3, CTLA4, CD80, CD28 and LAG3 are presented in the lower row of figure A. The immune subpopulation frequencies and intercellular distances as well as the MFI of ICP markers were assessed. Differences in the frequencies of immune cell subpopulations in 50 nnBM, 106 MDS, 36 CMML as well as 132 sAML are depicted as box plots: (b) TILs (%), (c) CD3+CD8+ T cells (%), (d) GrB+ cells (%), and (e) CD3−MUM1+ B/plasma cells (%). (f) Representative MSI picture of a BM with CD3+ (yellow) and CD3+CD8+ (yellow + magenta) T cells and their spatial relation to each other are shown. Differences in the mean spatial distance of (g) CD3+CD8− and CD3+CD8+ T cells and (H) CD3+ T cells and CD3−MUM1+ B/plasma cells are shown in box plots. Significant differences are marked with asterisks (*p < 0.05; **p < 0.001) and otherwise given with the exact p-value.
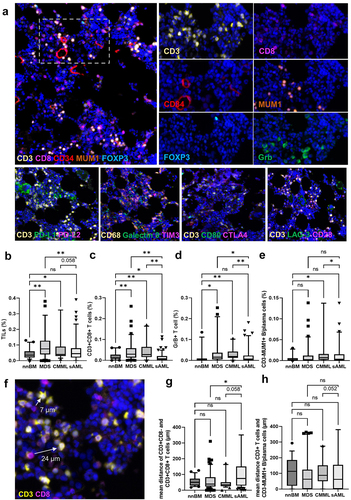
Figure 3. The immune cell infiltration, HLA-I expression and immune checkpoint (ICP) expression in the tumor microenvironment. the surface expression of different HLA-I antigens was determined by conventional IHC (a) and differences in the expression in the respective groups is depicted as box plots (b) showing HLA-A,B,C, HLA-E, HLA-F, and HLA-G. Significant differences are marked with asterisks (*p < 0.05; **p < 0.001) and otherwise given with the exact p-value. Next, HLA-I HC, HLA-Ib, ICP expression and immune cell frequencies are presented as a heat map. An unsupervised clustering of their expression was used for the TME classification. Red tiles denote increased expression, while blue tiles correspond to decreased expression (see color scheme heat map). The four horizontal bars above the heat map indicate the classification of age, sex, diagnosis (entity), and blast counts in the bone marrow.
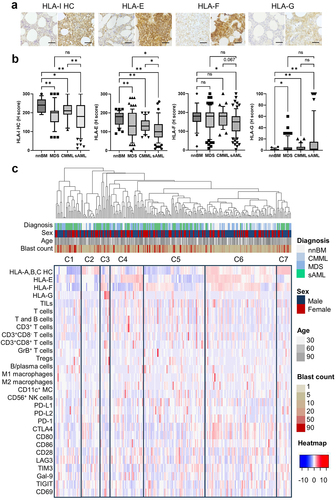
Figure 4. Complex interrelationship of immune cell composition, spatial immune cell organization, immune modulatory molecule expression, genetic aberrations and therapeutic interventions in myeloid neoplasm within the tumor microenvironment. correlation map (a) of the interplay of factors of the TME. Pearson correlation coefficients are displayed by different colors defined in the scale bar under the figure. Statistically significant correlations are highlighted with black frames. The interrelationship of number of detected mutations in individual samples is depicted with boxplots (b) concerning HLA-I HC expression, TILs, T cells and ICP expression of CTLA4 and PD-L1, was shown. Significant differences are given with the exact p-value.
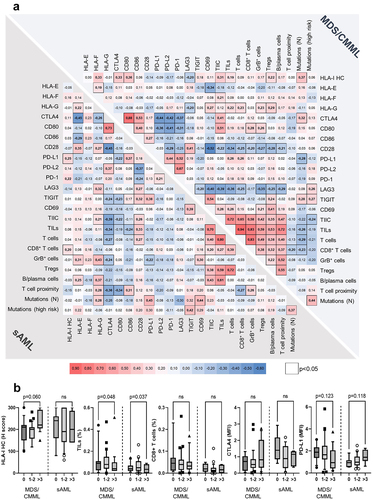
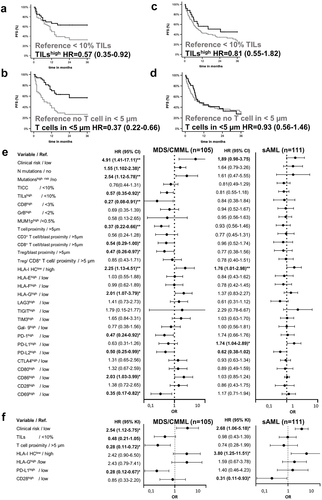
Figure 5. The prognostic impact of the tumor microenvironment in MDS/CMML and sAML. Kaplan–Meier estimators illustrate the influence of TILs and T cell densities in MDS/CMML (a-b) and sAML patients (c-d). Next, univariate cox regression analysis was performed (e) in MDS/CMML and sAML patients, respectively. Results are depicted with Forrest plots. Significant prognostic factors were further analyzed with a multivariate cox regression analysis and results are shown with Forrest plots, too (f). Significant differences are marked with asterisks (*p < 0.05; **p < 0.001).