
Figures & data
Figure 1. Characterization of tumor Treg-specific gene expression in ESCC. (a) Unsupervised t-SNE reduction plot of total T/NK cells in single-cell RNA sequencing data (GSE160269) containing ESCC tumor tissues (n = 60) and tumor-adjacent tissues (n = 4). (b) Feature plots of marker genes for T/NK-cell subset identification. (c) distribution of tumor- and tumor-adjacent tissue-derived T/NK cells in the t-SNE reduction plot. (d) Volcano plot of differentially expressed genes between T-Treg and N-Treg cells. Genes with a p value ≤ 0.05 and log2 (fold change) in expression ≥ 0.5 (red) or ≤ 0.5 (blue) in T-Tregs vs. N-Tregs are highlighted and enumerated. (e) GO pathways of enriched genes upregulated in T-Treg cells and ranked by the enrichment score. (f) Venn plot of different gene sets: top 20 Treg-specific genes compared with non-Treg leukocytes (red), top 50 genes correlating with FOXP3 expression in Treg cells (blue), and upregulated genes by T-Treg cells compared with N-Treg cells (green). Seventeen genes overlapped between FOXP3-associated genes and Treg cell-specific genes (red fill), and two genes overlapped between three gene sets (red font). (g) A bar chart showing 17 overlapping genes between FOXP3-associated genes and Treg cell-specific genes in (F) ranked by the t value of Treg-specific genes (bottom axis). The line chart indicates Pearson’s correlation ratio of these 17 genes with FOXP3 (top axis). Genes in red font overlapped between the three gene sets in (F).
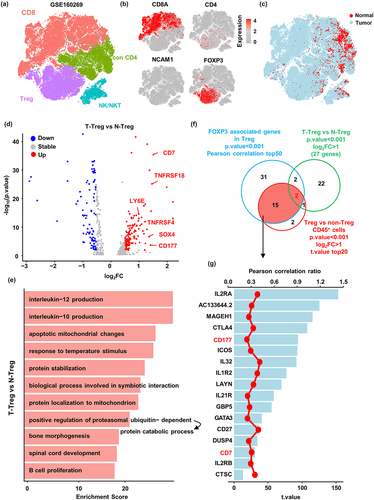
Figure 2. CD177 marks a unique Treg cell subset enriched in ESCC tumor tissue. (a) Unsupervised UMAP reduction plot of Treg cells in single-cell RNA sequencing data (GSE160269) containing ESCC tumor tissues (n = 60) and tumor-adjacent tissues (n = 4). (b) Feature plot of FOXP3 and CD177 expression in Treg cells. (c) Distribution of tumor- and tumor-adjacent tissue-derived Treg cells in the UMAP reduction plot. (d) Unsupervised UMAP reduction plot of total CD45-positive cells and cell subsets. TAM, tumor associated macrophage; Tmem, memory T; Tnaive, naïve T; teff, effector T; Tex, exhausted T; Th17, T helper 17. (e) CD177 expression profile in total CD45-positive cells from ESCC tissues and tumor-adjacent tissues. (f) Flow cytometry data of CD177-positive cells among different immune cell subsets from ESCC tumor tissues (n = 4). Con CD4, non-Treg conventional CD4+ T. (g) Representative flow cytometry data and (H) statistical analysis of CD177+ Treg cells from tumor tissues, tumor-adjacent tissues, normal esophagus tissues and PBMCs (n = 4). (I) Statistical analysis of CD177+ granulocytes from tumor tissues, tumor adjacent tissues, normal esophagus tissues and PBMCs (n = 4). ***p < 0.001, Student’s t test.
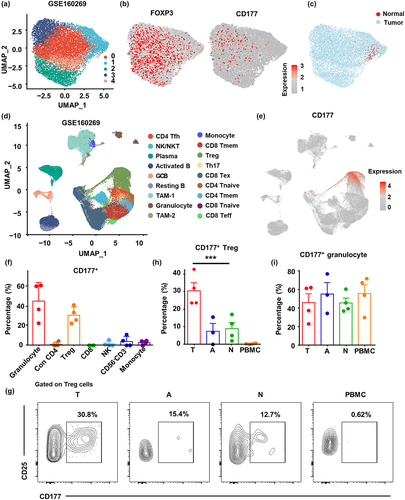
Figure 3. PD-1+ and CD177+ Treg cells represent two distinct Treg cell subsets in ESCC. (a) Unsupervised UMAP reduction plot of PDCD1 expression profile in Treg cells from ESCC. (B) Representative flow cytometry results of CD177 and PD-1 expression patterns on tumor Treg cells (CD45+CD3+CD56−CD4+CD127−CD25+). (C) Semi-supervised UMAP reduction plot of Treg cells in single-cell RNA sequencing data containing ESCC tumor tissues (n = 60) and tumor-adjacent tissues (n = 4). Treg cells were divided into three subsets according to PDCD1 and CD177 expression. (D) Feature plots showing expression patterns of FOXP3, PDCD1 and CD177 in Treg cells. (E) Top five enriched GO pathways of genes expressed by the three Treg subsets. (F) Heatmap showing the expression pattern of genes from two Treg function-associated gene sets by the three Treg cell subsets. (G) Spearman’s correlation analysis between the CD177+ Treg score and EBI3 in ESCC microarray data (GSE53625), Spearman’s correlation coefficient was shown as rs. (H) 4,000 CD177+, PD-1+, or DN Treg cells from the tumor and tumor-adjacent tissues were sorted and stimulated ex vivo with human anti-CD3 (2 µg/ml), anti-CD28 (1 µg/ml) and rhIL-2 (50 U/ml) in a 96-well round bottom plate respectively. After 72 hours, the supernatants were collected for ELISA analysis of IL-10 and IL-35. (I) Pearson’s correlation analysis between the CD177+ Treg cell percentage and the percentages of different immune cell types from ESCC single-cell RNA sequencing data.
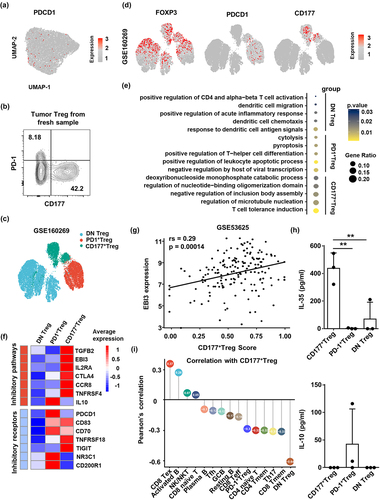
Figure 4. Pan-cancer analysis reveals different developmental trajectories of CD177+ and PD-1+ tumor Treg cells. (a) Semi-supervised UMAP reduction plot of Treg cells from single-cell RNA sequencing data of pan-cancer tumor tissues and tumor-adjacent tissues (GSE156728). (b) Feature plots showing expression patterns of FOXP3, PDCD1 and CD177 in Treg cells. (c) Heatmap showing the top five differentially expressed genes in the three Treg cell subsets. (d) TCR repertoire abundance and occupied repertoire space of the three Treg cell subsets. (e) Sankey chart displaying the top 10 abundant TCR clonotypes of CD177+ Treg and PD-1+ Treg cells and potential common clonotypes between these two subsets. (f) Pseudotime trajectory analysis of pan-cancer Treg cells showing two different developmental trajectories of CD177+ Treg and PD-1+ Treg cells from DN Treg cells.
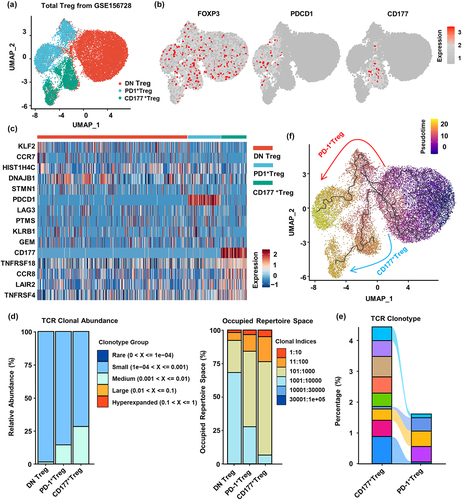
Figure 5. Higher CD177+ Treg cell infiltration is associated with poor survival of ESCC patients. (a) Analysis of compositions of the three Treg cell subsets in tumors from patients with different pathologic stages, T stages and N stages in ESCC single-cell RNA sequencing data (GSE160269). (b) Predicted CD177+ Treg cell score of tumor tissues and normal tissues using Cibersort from ESCC microarray data (GSE53625). (c) Overall survival probability of ESCC patients with high or low CD177+ Treg cell score from the GSE53625 cohort. (d) Disease-free probability and overall survival probability of ESCC patients with high or low CD177+ Treg cell scores based on proteomic data from another cohort (PXD021701). p value was calculated using Kaplan – Meier (log rank) test.
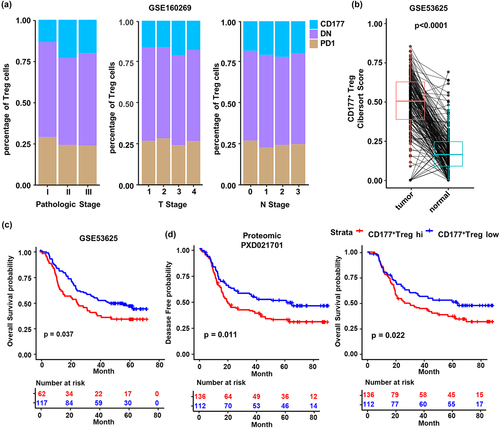
Figure 6. Anti-PD-1 immunotherapy impairs CD177+ Treg and boosts PD-1+ Treg cells in ESCC. (a) Representative flow cytometry result of CD177 and PD-1 expression by tumor Treg cells from surgical samples of untreated patients and patients with a partial response to neoadjuvant anti-PD-1 immunotherapy plus chemotherapy. (b) Statistical analysis of CD177+ Treg cell percentages in tumor tissues, tumor-adjacent tissues, normal esophagus tissues and PBMCs from untreated patients (n = 4) and patients treated with neoadjuvant anti-PD-1 immunotherapy plus chemotherapy (n = 5). (c) Statistical analysis of PD-1+ Treg cell percentages in tumor tissues, tumor-adjacent tissues, normal esophagus tissues and PBMCs from untreated patients (n = 4) and patients treated with neoadjuvant anti-PD-1 immunotherapy plus chemotherapy (n = 4). (d) Multiplexed immunohistochemistry staining of tumor tissues and tumor-adjacent tissues from untreated patients and patients with PR and SD after neoadjuvant anti-PD-1 immunotherapy plus chemotherapy. White arrows indicate CD177+ non-Treg cells which may be granulocytes. (e) Statistical analysis of percentages of different Treg cell subsets in tumor (T) from untreated patients (n = 19) and patients with PR (n = 12) and SD (n = 9) after neoadjuvant anti-PD-1 immunotherapy plus chemotherapy. (f) Cell density of three Treg cell subsets in tumor tissue of ESCC patients among different cohorts, UT, PR and SD. Statistical analysis was performed using Student’s t-test. *p < 0.05, **p < 0.01, ***p < 0.001.
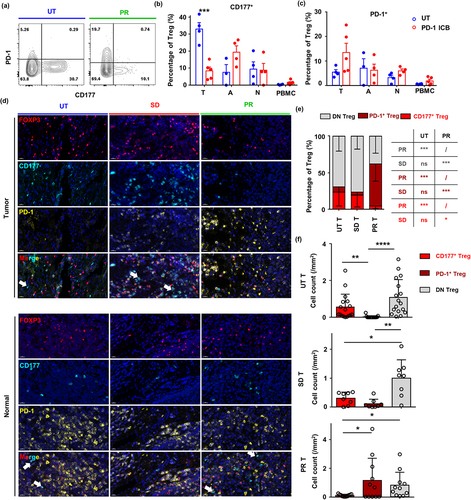
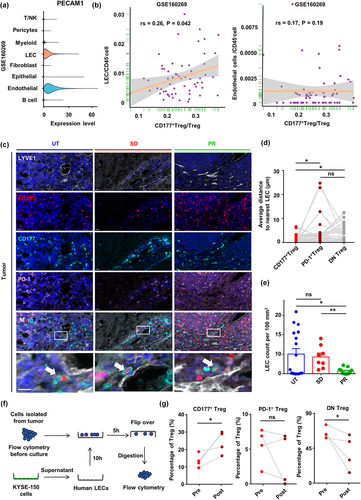
Figure 7. CD31 expression by lymphatic endothelial cells is associated with CD177+ Treg cell accumulation in tumor tissue in ESCC. (a) Expression of the CD177 ligand PECAM1 (CD31) by different cell subsets in ESCC single-cell RNA sequencing data (GSE160269). (b) Spearman’s correlation analysis of the percentage of LECs and endothelial cells and CD177+ Treg cells from ESCC single-cell RNA sequencing data (GSE160269). Spearman’s correlation coefficient was shown as rs. (c) IHC staining of LYVE1, CD177, PD-1, and FOXP3 in tumor tissue from UT (n = 17), SD (n = 8) and PR (n = 11) ESCC patients. (d) Statistical analysis of average distance between three Treg cell subsets and nearest LEC in tumor tissues of all patients (n = 36). Statistical analysis was performed using a paired Student’s t-test. (e) Statistical analysis of LEC density between UT (n = 17), SD (n = 8) and PR (n = 11) tumor tissues. (f) Adhesion assay strategy: cells were isolated from tumor and adjacent non-cancerous tissues and tested with flow cytometry to evaluate the proportions of the three Treg cell groups before co-culture. Subsequently, these cells are co-cultured for 5 hours with human primary LECs that have been pre-treated with supernatant from the ESCC tumor cell line KYSE-150. Afterward, the culture dish is flipped over, remaining cells are digested with 0.25% trypsin for flow cytometry analysis. (g) Bar chart showing the change in proportions of the three Treg cell groups before and after the adhesion assay experiment. Statistical analysis was performed using an unpaired or paired Student’s t-test. *p < 0.05, **p < 0.01, ***p < 0.001.
Supplemental Material
Download Zip (16.3 MB)Data availability statement
All data generated in this manuscript will be provided upon request to corresponding authors.