Figures & data
Figure 1. Humoral complementomics of ccRCC: plasma complement protein levels and association with inflammation. Plasma complement protein levels in (a–j) the ExhauCRF ccRCC discovery cohort (n = 25, except for MASP2 n = 23) vs healthy controls (n = 28, except MASP2 n = 10), and K-S) the ImmPro ccRCC validation cohort (n = 75) vs healthy controls (n = 33). Correlation of plasma calprotectin and complement levels among T) ExhauCRF ccRCC patients, and U) ImmPro ccRCC patients; circles represent the spearman correlation coefficient and only correlations with adjusted p-value >0,05 (Benjamini-Hochberg) are shown. For the comparison of plasma complement levels between ccRCC vs healthy: * p-value ≤0,05; ** p-value <0,01; *** < 0,001; **** p-value <0,0001. Mann–Whitney test. The cutoff of the normal range is calculated as mean ±2SD, patients above this limit are boxed by a red square, and the number of patients concerned is marked beside.
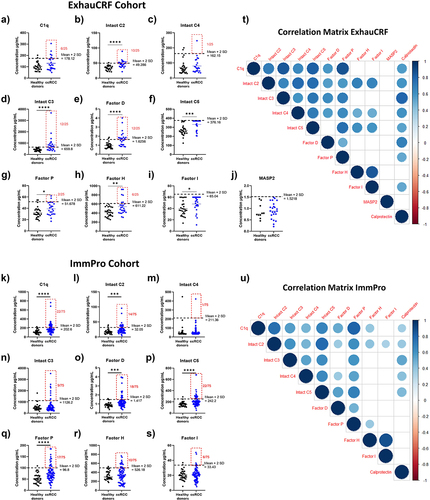
Figure 2. Humoral complementomics of ccRCC: plasma complement activation fragments. (a–g) comparison of plasma complement activation fragment levels in the ExhauCRF ccRCC discovery cohort (n = 25, except for MASP1/C1INH n = 23) vs healthy controls (n = 28, except MASP1/C1INH n = 10) (h–n) comparison of plasma complement activation fragment levels in the ImmPro ccRCC validation cohort (n = 75) vs healthy controls (n = 33). * p-value ≤0,05; ** p-value <0,01; *** < 0,001; **** p-value <0,0001. Mann–Whitney test. The cutoff of the normal range is calculated as mean ±2SD, patients above this limit are boxed by a red square, and the number of patients concerned is marked beside.
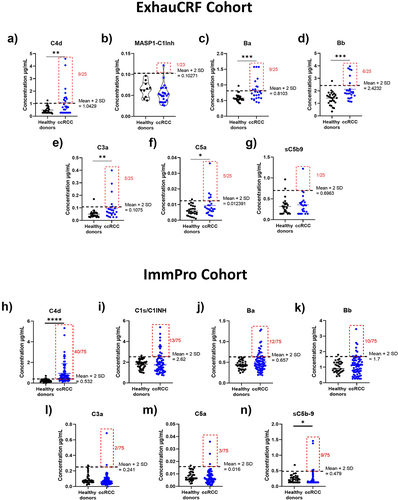
Figure 3. Complement proteins are found at the tumor cell membrane and intracellularly. immunohistochemistry against C1q highlighted staining (a) in immune cells, (b) at the tumor cell membrane, and (c) intracellularly in tumor cells. Immunohistochemistry against C4d highlighted staining (d) at the tumor cell membrane, and (e) intracellularly in tumor cells. (f) association between the concentration of C4d in plasma and the presence of C4d at the surface of tumor cells intratumorally determined by Wilcoxon rank sum test. (g) immunofluorescence multiplex showed colocalization of IgG, C1q, C1s, and C4d at the surface of tumor cells. Immunofluorescence multiplex showed co-localization of (h) C3 and FB, and (i) C3 and FH at the surface of tumor cells. (j) immunofluorescence multiplex showed colocalization of C4, C3 and FB. Immunohistochemistry against FH highlighted staining (k) at the tumor cell membrane, and (l) intracellularly in tumor cells. Immunohistochemistry against C5b9 in (m) ccRCC primary tumor, and (n) lupus nephritis glomerulus.
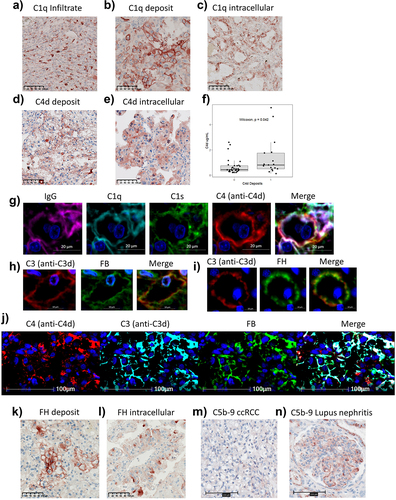
Figure 4. Humoral complementomics of ccRCC: autoantibody profiles in ImmPro cohort vs healthy controls. IgA autoantibodies against (a) FB, (b) C3, (c) native FH, and (d) reduced FH in ccRCC patients compared to healthy controls. IgM autoantibodies against (e) FB, (f) C3, (g) native FH, and (h) reduced FH. IgG autoantibodies against (i) FB, (j) C3, (k) native FH, and (l) reduced FH in ccRCC patients compared to healthy controls. 98 ccRCC patients and 59 healthy controls were analyzed. * p-value ≤0,05; ** p-value <0,01. Mann–Whitney test. The cutoff of the normal range is calculated as mean ±2SD.
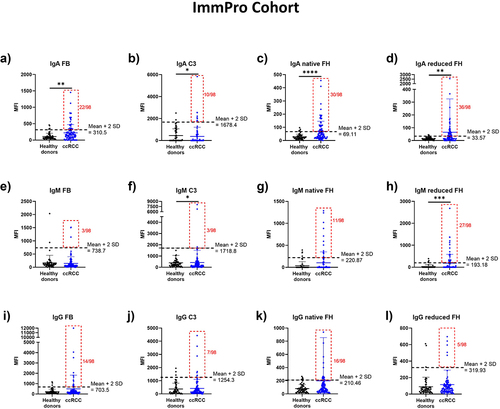
Figure 5. Humoral complementomics of ccRCC: complement profiles at the time of nephrectomy associate with clinical features in ccRCC. (a) heatmap of hierarchically clustered ccRCC patients (n = 49) across the different complement features in the ImmPro cohort. Each row represents an individual subject and each column represents a complement feature. Complement measurements are scaled and centered per feature and the range was truncated ±3 SD. Higher responses are indicated in red and lower responses are indicated in blue. (b) PFS Kaplan Meier curves of ImmPro patients stratified according to hierarchical clustering, log-rank test p-value is shown. Association of hierarchical clusters with (c) Fuhrman grade, and (d) TNM stage, p-values were calculated using a two-sided Fisher’s exact test. PFS: progression-free survival; CS1: cluster 1; CS2: cluster 2.
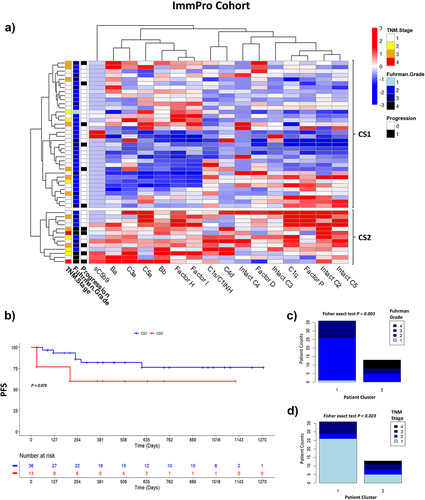
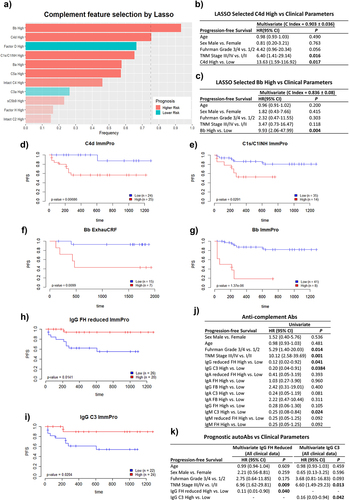
Figure 6. Humoral complementomics of ccRCC: complement activation and IgG FH reduced levels in plasma predict patient prognosis in ccRCC. (a) frequency of selected complement features by multivariate Lasso regularized cox regressions fitted to 1000 bootstrapped samples constructed from the ImmPro cohort. The bar plot represents the relative number of times that each complement feature had non-zero coefficients in the models, red bars (“higher risk”) indicate selection frequencies for variables with positive coefficients in more than 50% of the models selecting the variable. Blue bars are indicative of frequencies associated with variables having negative coefficients. (b–c) multivariate cox regression analysis of clinical features and Lasso selected features C4d and bb, respectively. PFS Kaplan – Meier curves according to (d) C4d, (e) C1S/C1-IHN plasma levels in the ImmPro validation cohort. PFS Kaplan – Meier curves according to bb plasma levels in the (f) ExhauCRF discovery cohort and (g) ImmPro validation cohort. PFS Kaplan – Meier curves according to (h) IgG FH reduced, and (i) IgG C3 plasma levels in the ImmPro validation cohort. (j) univariate and (k) multivariate cox regression analysis of clinical features and anti-complement autoantibody features in ImmPro cohort.