
Figures & data
Figure 1. Effect of TGF-β1 on organoids and immune cells.
(a) TGF-β1 in conditioned medium (CM) from KPN organoids at 72 h. (b) KPN cells cultured with mouse TGF-β1 or CM for 72 h. (c) Anti-CD3 stimulated splenocytes (St) cultured with CM for 72 h. (d) Unstimulated or anti-CD3 stimulated splenocytes (St) cultured with CM and ALK5i or anti-TGF-β for 72 h. (e) To activate naïve cells, anti CD3 stimulated splenocytes treated with TGF-β1 and ALK5i, or anti-TGF-β for 72 h. (f) For pre-activation, anti-CD3 stimulated cells rested, restimulated with anti-CD3, with TGF-β1 and treated for 72 h. In Fig B-D, cell proliferation evaluated by cell titer glo. In Fig E-F, IFN-γ measured by ELISA. Data shown as mean±SD (n = 2–3). Statistical analysis: One-way ANOVA with Tukey’s multiple comparison test (Prism v9) p-value for significance *<0.05, **<0.01, ***<0.001, ****<0.0001.
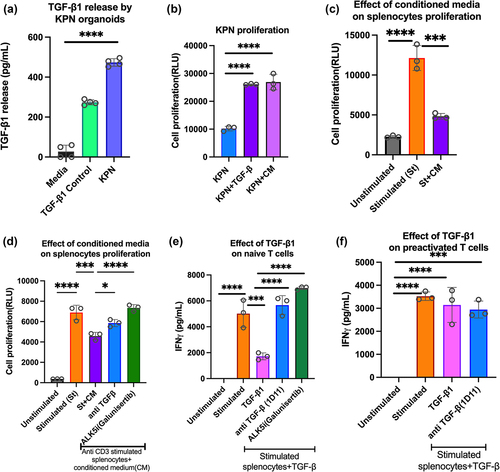
Figure 2. TGF-β1 inhibitor reduces neutrophils, epithelial cells and enhances inflammatory monocytes in KPN metastases in vivo.
(a) Dosing strategy for mice with KPN metastatic tumors, treated with ALK5i or vehicle, by oral gavage (OG). (b) Normalised liver: body weight ratio between vehicle (n = 5) and ALK5i treated (n = 4). (c) Differences in EpCAM+ cells between vehicle and ALK5i (n same as B). (d) Counts of Ly6G+ neutrophils between vehicle (n = 5) and ALK5i (n = 5), from IHC. (e) Metastatic area selected for counting Ly6G+ cells from untreated and ALK5i treated mice(representative). (f) Flow cytometer plots and (g) counts showing Ly6C+ monocytes, Ly6C+MHCII+ monocytic intermediates and Ly6C−MHCII+ macrophages (n same as B). Data presented with median, minimum, and maximum values. Statistical analysis using Mann Whitney test, with p-value for significance *<0.05, **<0.01. (h) Expression of Ly6c1 gene from metastatic area of liver FFPE sections, evaluated by TempOseq. Ly6c1 is significant at p adj value of 0.006, represented as ** in the boxplot.
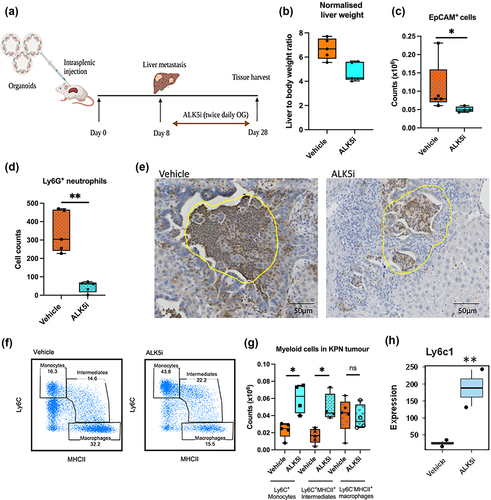
Figure 3. TGF-β1 inhibitor enhances lymphocyte infiltration and PD-1/PD-L1 expression into KPN metastases.
KPN liver metastases, treated with ALK5i or vehicle, were digested and stained. Live CD45+CD3+ cells were gated. (a) Counts of CD45+ cells, CD3+T, CD4+T and CD8+T lymphocytes in KPN metastases treated with vehicle control (n = 5) or ALK5i (n = 4). (b) counts of CD69+CD3+T cells, CD69+CD4+T cells, and CD69+CD8+T cells. (c) PD-L1 on CD3− and CD3+T cells and PD1 on CD3+T cells between vehicle (n = 5) and ALK5i (n = 4). Statistical analysis: Mann Whitney, with p-value <0.05 considered significant (*<0.05) (Prism). (d) Boxplot of Cd274 expression (TempOSeq), from metastatic liver FFPE sections comparing vehicle with ALK5i treatment. (e) Difference in frequencies of CD3+T-bet+ cells, CD3+IFN-γ+ in the MLN and CD3+IFN-γ+ in the spleen between vehicle (n = 5) and ALK5i (n = 5). Statistical analysis for Figures A, B, C and E was done using an unpaired Mann Whitney test. p value for significance *<0.05, **<0.01.
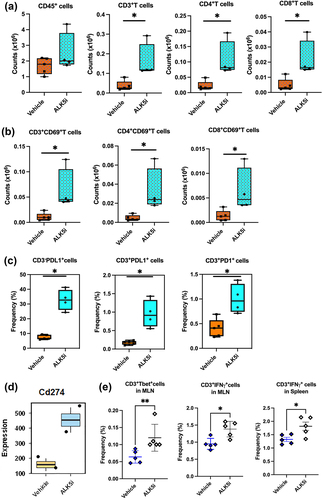
Figure 4. TGF-β1 inhibitor enhances expression of IRF1 associated genes.
TempO-Seq results from metastases from liver FFPE sections after vehicle or ALK5i treatment. (a) Volcano plot representing differentially expressed genes between the two treatment groups (significantly upregulated genes in red, downregulated genes in blue and no change in black). (b-c) Changes in gene expression of IRF1 and STAT1 pathway associated genes (most activated upstream regulators, TRUSST database) between vehicle (n = 2) and ALK5i (n = 2). (d) Genes associated with cellular response to interferon gamma are significantly upregulated after ALK5i treatment (Nos2 p-adj value 0.03 represented as * and Trim31 p-adj value 0.006 represented as **)
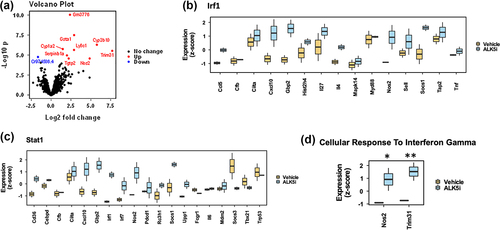
Figure 5. Inhibition of TGF-β and PD-L1 boosts infiltration of CD8+T cells.
(a) Schematic representation of KPN metastases treated with vehicle, single and combination treatments. (b) Dot plots showing frequencies (%) of CD3+T cells. (c) Counts of CD45+, CD3+, CD4+ and CD8+T cells between vehicle (n = 6), ALK5i + isotype (n = 5), anti-PD-L1+ vehicle (n = 4) and ALK5i + anti-PD-L1 (n = 4). (d) CD69+CD3+, CD69+CD4+, CD69+CD8+T cells, and PD1+CD3+T cells (n as for C) in the four groups. (e) Granzyme B+CD8+T cells between treatments (n as for C). Data plotted as mean ± SEM. Statistical analysis: Kruskal Wallis with Dunn’s multiple comparison test. All treatment groups are compared to vehicle, and p < 0.05 considered significant (*<0.05, **<0.01, ***<0.001).
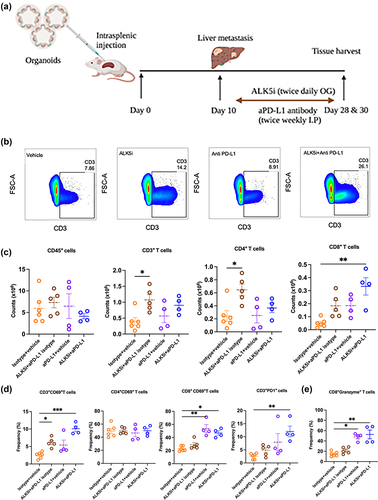
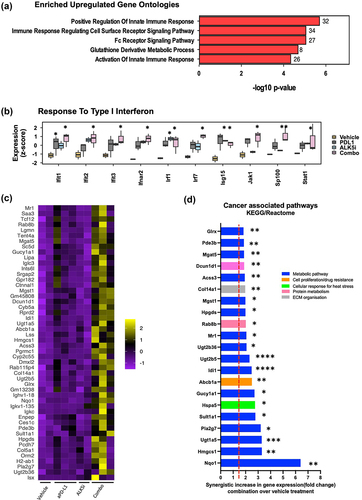
Figure 6. Co-inhibition of TGF-β and PD-L1 upregulates IRF-1 and cancer associated metabolic pathway genes.
Mice with KPN metastases treated with vehicle + isotype (n = 2), ALK5i + isotype (n = 2), anti-PD-L1 + vehicle (n = 3), or ALK5i + anti-PD-L1 (n = 3). TempO-Seq sequencing performed with metastases from liver FFPE sections. (a) 5 most enriched GO pathways comparing combination treatment to vehicle and (b) response to Type1 interferon associated genes. * Represents adjusted p value *< 0.05 and **<0.01 (treatment groups compared to vehicle). (c) Heatmap and boxplot showing top 50 genes synergistically upregulated after combination treatment. Clustering shown is hierarchical. (d) Bar graph showing ratio observed/expected and associated pathways for synergistic genes, evaluated using KEGG and Reactome pathway analyses. P adj value *<0.05, **<0.01, ***<0.001 and ****<0.0001 (combination treatment vs vehicle).
Supplemental material
Supplemental Material
Download Zip (18.4 MB)Data availability statement
The data generated in this study are available upon request from the author.