Figures & data
Figure 1. ML NK cells from healthy donors exhibit enhanced functionality against colorectal cell lines. a) schema shows the generation of ML NK cells and cNK cells. b, c) IFN-γ production by cNK (b, upper) and ML NK (b, lower) cells stimulated with all four CRC cell lines. Control and ML NK cells were incubated with HT29 and HCT116 at different E:T ratios and specific lysis was assessed in a 51Cr release assay (d, e) and incucyte (f, g). For incucyte, GFP expressing HT29 and HCT116 cells were incubated with NK cells at 2.5 E:T ratio for 72 h. F and G show one representative example from 3 different donors in 3 independent experiments. n = 7–12 in C, n = 3 in D and E. Two-way ANOVA with Sidak post test. *p < 0.05, ***p < 0.001, ****p < 0.0001.
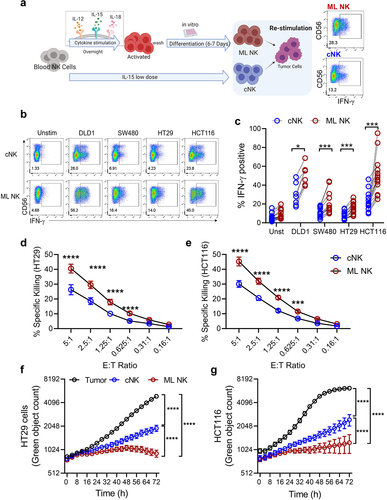
Figure 2. ML NK cells control CRC cells growing in spheroids more efficiently than cNK cells. spheroids generated from GFP+ HCT116 (a–c) and HT29 (d–f) cells were incubated with cNK or ML NK cells at different E:T ratios. (a, d) Representative images at baseline and at 24 h of spheroids (green) and labeled NK cells. (b, e) quantitation of GFP+ area of spheroid images. Untreated spheroids were used as control. (c, f) annexin V/7-AAD flow cytometry-based killing assay. Spheroids were co-cultured with cNK or ML NK cells at indicated E:T ratio for 4 hours and then dissociated for flow cytometric analysis. Percent of specific killing was calculated as the decrement in annexin V/7-AAD negative viable tumor cells compared to tumor cells alone. Two-way ANOVA with Tukey posttest for imaging, two-way repeated measures ANOVA for flow-based killing assay. *p < 0.05, **p < 0.01, ***p < 0.001, ****p < 0.0001.
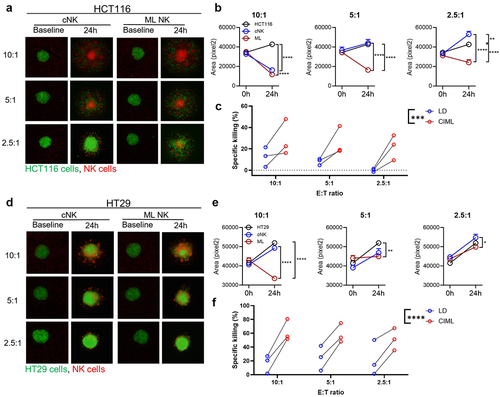
Figure 3. NKG2D is the main activating receptor driving ML NK cells against CRC cells. cNK and ML NK cells from healthy donors were incubated with blocking Abs for 30 min before the stimulation with HCT116 cells at 5:1 E:T ratio. a) Representative flow plots and b) summary data of IFN-γ production by cNK and ML NK cells stimulated with HCT116 cells without and with single and combined mAb blockade. Live imaging analysis using incucyte shows killing activity of c) cNK and d) ML NK cells against HCT116 cells in presence of antibody blockade. IgG1 isotype was used as control. *p < 0.05, **p < 0.01, ***p < 0.001, ****p < 0.0001.
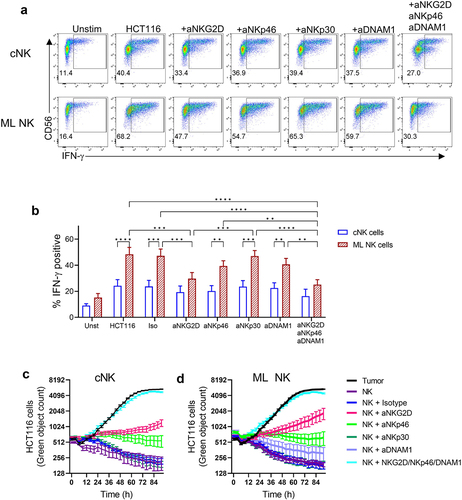
Figure 4. ML NK cell from HD and CRC patient samples have improved response against CRC cells, including patient derived spheroids. a) HD cNK and ML NK cells were stimulated with patient derived spheroids (5:1 E:T ratio). b) Representative dot plot and c) summary data show IFN-γ production by cNK and ML NK cells. n = 7. d) annexin V/7-AAD flow cytometry-based killing assay on two patient-derived spheroid lines. Spheroids were partially dissociated and co-cultured with healthy donor cNK or ML NK cells at indicated E:T ratio for 4 hours and then processed into a single cells for flow cytometric analysis. Percent of specific killing was calculated as the decrement in annexin V/7-AAD negative viable tumor cells compared to tumor cells alone, n = 7–8. E), patient derived ML NK cells and cNK cells were incubated with HCT116 and HT29 cells (5:1 E:T ratio). f, Representative flow plot and g) summary data show the frequency of IFN-γ producing cells by patient cNK and ML NK cells in response to CRC cell lines. n = 8. Cytotoxicity of cNK and ML NK cells against GFP expressing h) HCT116 and I) HT29 was assessed using incucyte. Two-way repeated measures ANOVA (d). Two-way ANOVA with Sidak (c, g) and holm-Sidak posttest (h, i). *p < 0.05, **p < 0.01, ***p < 0.001, ****p < 0.0001.
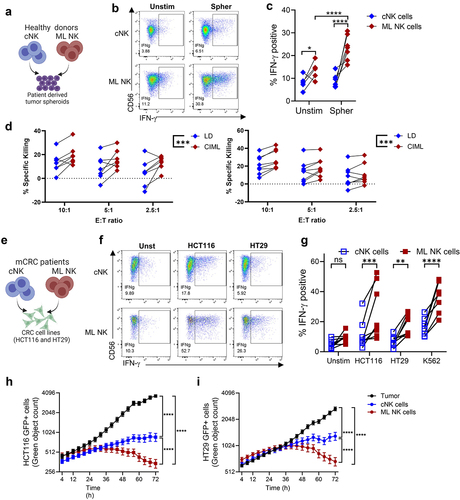
Figure 5. ML NK cells control HCT116 cells better than cNK cells in a xenograft model in NSG mice. a) irradiated NSG mice (day −3) were injected with 1 × 10⁵ (ip.) Luc+ HCT116 cells at day 0. At day 1, 5 × 10⁶ cNK or ML NK cells were injected (ip) and the tumor burden assessed biweekly by BLI. b) BLI images in representative from one of three independent experiments. c) summary data indicate that allogenic ML NK cells control CRC cells in vivo better than cNK cells. Data from all mice from the three experiments (total untreated = 17 mice, cNK cells = 11 mice, and ML NK cells = 11 mice). Two-way ANOVA – mixed-effect model with Tukey posttest. **p < 0.001.
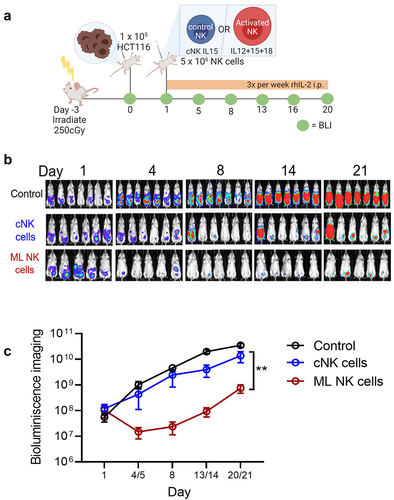
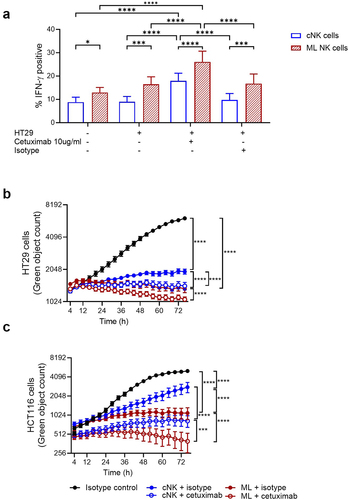
Figure 6. Cetuximab enhances functional response of cNK and ML NK cells against CRC cell lines regardless their molecular profile. a) IFN-γ production by HD cNK and ML NK cells incubated with untreated, isotype treated (human IgG1) and cetuximab-treated HT29 and HCT116 cells was assessed by flow cytometry. n = 5. Cytotoxicity of b) HT29 and c) HCT116 cells by isotype or cetuximab-treated cNK and ML NK cells was evaluated using incucyte. One representative example from three replicates is shown in b and c. Two-way ANOVA with a) Sidak and b, c) Tukey posttest. *p < 0.05, **p < 0.01, ***p < 0.001, ****p < 0.0001.