
Figures & data
Figure 1. Accumulation of CD56dimCD16– NK cells expressing PD-1 in ovarian tumors. a. Representative flow-cytometric dot plots showing the gating strategy used to identify circulating (PBMCs from healthy donors; left panels) and tumor-infiltrating (melanoma and epithelial ovarian tumors; middle and right panels, respectively) NK cell subsets. Cells were first gated in CD45+SSC-Alow and NK cells identified as lineage (Lin; CD3, TCRαβ, TCRγδ, CD14, CD19, CD20, CD34, CD123, CD303, FCεRI)–CD127–CD56+. Subsequently, three populations were identified based on CD56 and CD16 expression levels, namely CD56brightCD16– NK cells, CD56dimCD16– NK cells, and CD56dimCD16+ NK cells. b. Frequency of circulating and tumor-infiltrating (from left to right) CD56brightCD16– NK cells, CD56dimCD16+ NK cells, and CD56dimCD16– NK cells. c. Heatmap showing the log2 fold change in geometrical mean fluorescent intensity (gMFI) of indicated parameters between circulating and tumor-infiltrating NK cell subsets. Circulating cells from healthy donors set as the reference. An asterisk denotes statistical significance between circulating and tumor-infiltrating groups. d. Bar graphs showing the gMFI of CD94, CD161 and NKp46 (from top to bottom) expression on circulating and tumor-infiltrating NK cell subsets. E. Representative flow-cytometric histograms (left), gMFI (top right) and frequency (bottom right) of PD-1 expression on circulating and tumor-infiltrating NK cell subsets. B, D, E. Data show mean±SEM. Each dot represents one sample. Statistical analyses were performed using one-way ANOVA followed by a Tukey’s multiple comparisons test. *p < 0.05; **p < 0.01; ***p < 0.001; ns, not significant.
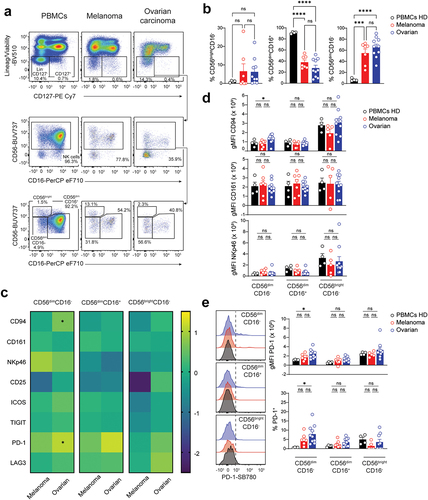
Figure 2. Enrichment in ILCps at the expense of cytotoxic ILCs, ILC2 and ILC3. a. Representative flow-cytometric dot plots showing the gating strategy used to identify circulating (PBMCs from healthy donors; left panels) and tumor-infiltrating (melanoma and epithelial ovarian tumors; middle and right panels, respectively) ILC subsets. Cells were first gated in CD45+SSC-Alow and ILCs identified as lineage (Lin; CD3, TCRαβ, TCRγδ, CD14, CD19, CD20, CD34, CD123, CD303, FCεRI)–CD127+. Cytotoxic ILCs, ILC1, ILC2, CD117+CRTH2–, NKp46-ILCp and ILC3 were identified as CD56+CD94+, CD56–CD94–CD117–CRTH2–, CD56–CD94–CD117±CRTH2+, CD56–CD94–CD117+CRTH2–, CD56–CD94–CD117+CRTH2–NKp46–, and CD56–CD94–CD117+CRTH2–NKp46+, respectively. B-D. Frequency of circulating and tumor-infiltrating (b, from left to right) ILCs and cytotoxic ILCs, (c) ILC1, ILC2, and CD117+CRTH2–, and (d) NKp46–ILCp and ILC3. B-E. Data show mean±SEM. Each dot represents one sample. Statistical analyses were performed using one-way ANOVA followed by a Tukey’s multiple comparisons test. *p < 0.05; **p < 0.01; ***p < 0.001; ns, not significant.
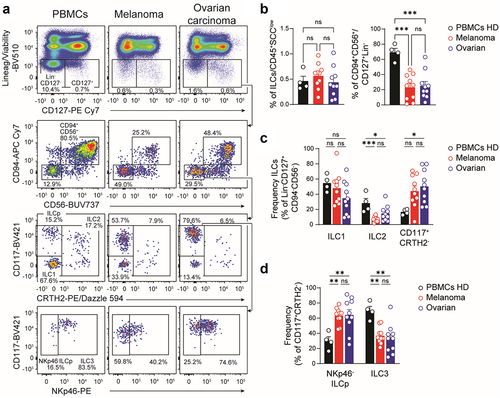
Figure 3. Tumor-infiltrating cytotoxic ILCs displayed reduced NK-cell related markers expression. a. Representative flow-cytometric dot plots showing the frequency of cytotoxic ILCs according to their tissue of origin. b. Geometrical mean fluorescent intensity (gMFI) of CD94 and CD56 expression on cytotoxic ILCs isolated from healthy donors, melanoma or ovarian carcinoma patients. c. Heatmap showing the log2 fold change in gMFI of indicated parameters between circulating and tumor-infiltrating cytotoxic ILCs. Circulating ILCs from healthy donors set as the reference. Asterisk denotes statistical significance between circulating and tumor-infiltrating groups. d. Representative histograms (left) and gMFI (right) of NKp46 expression. e. Representative histograms (left), gMFI (middle), and frequency (right) of CD16 positive cytotoxic ILCs according to their tissue of origin. f. Representative histograms (left) and frequency (right) of CD25, TIGIT, LAG3, TIM3, CD161, PD-1, CD117, ICOS expression on cytotoxic ILCs. FMO controls are shown in light gray. B,D-F. Data show mean+SEM. Each dot represents one sample. Statistical analyses were performed using one-way ANOVA followed by a Tukey’s multiple comparisons test. *p < 0.05; **p < 0.01; ***p < 0.001; ns, not significant.
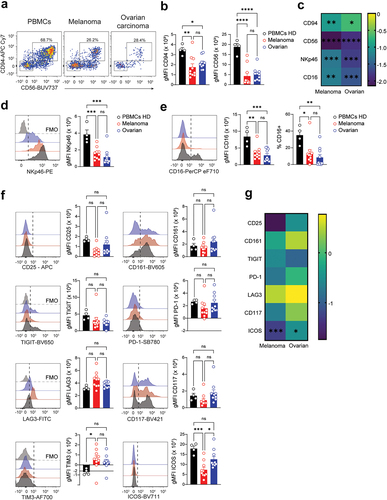
Figure 4. Tumor-infiltrating ILC2 express PD-1 and LAG3. a. Representative flow-cytometric dot plots showing the frequency of ILC2 and the proportion of CD117+ and CD117– cells according to their tissue of origin b. Cumulative frequency of circulating and tumor-infiltrating CD117– and CD117+ ILC2 subsets. c. Heatmap showing the log2 fold change in gMFI of indicated parameters between circulating and tumor-infiltrating ILC2 subsets. Circulating ILC2s from healthy donors set as the reference. Asterisk denotes statistical significance between circulating and tumor-infiltrating groups. d. Bar graphs showing the gMFI of CRTH2, CD127 and CD161 (from left to right) expression on circulating and tumor-infiltrating ILC2 subsets. e. Representative histograms (top) and quantification of the gMFI (middle) and frequency (bottom) of (from left to right) CD25, ICOS, TIGIT, PD-1 and LAG3 expression on CD117–ILC2 and CD117+ILC2. FMO controls are shown in light gray. B,D,E. Data show mean+SEM. Each dot represents one sample. Statistical analyses were performed using one-way ANOVA followed by a Tukey’s multiple comparisons test. *p < 0.05; **p < 0.01; ***p < 0.001; ns, not significant.
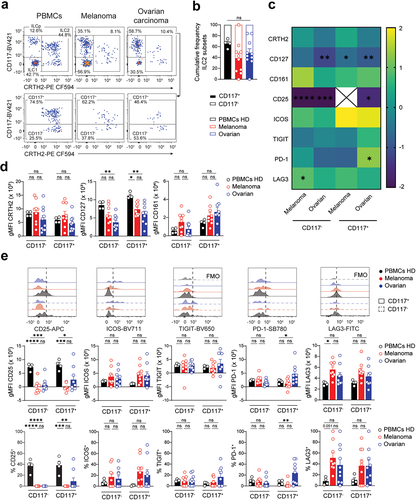
Figure 5. Reduced CD25 expression on tumor-infiltrating NKp46–ILCps. a-b. Representative histogram (left) and quantification of the gMFI (middle) and frequency (right) of CD25 (a) and CD161 (b) expression on NKp46–ILCps. c. Heatmap showing the log2 fold change in gMFI of indicated parameters between circulating and tumor-infiltrating NKp46–ILCps. Circulating NKp46–ILCps from healthy donors set as the reference. Asterisk denotes statistical significance between circulating and tumor-infiltrating groups. d. Representative histograms (top) and quantification of the gMFI (middle) and frequency (bottom) of (from left to right) ICOS, TIGIT, PD-1 and LAG3 expression on NKp46–ILCps. FMO controls are shown in light gray. a,b,d. Data show mean+SEM. Each dot represents one sample. Statistical analyses were performed using one-way ANOVA followed by a Tukey’s multiple comparisons test. *p < 0.05; **p < 0.01; ***p < 0.001; ns, not significant.
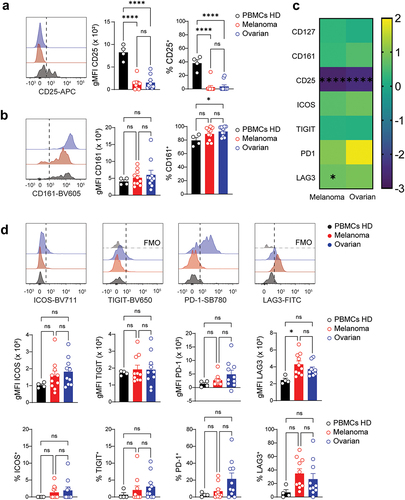
Figure 6. NKp46+ILC3s infiltrating melanoma tumors overexpress LAG3. a. Geometrical mean fluorescent intensity (gMFI) of NKp46 expression on NKp46+ILC3s isolated from healthy donors, melanoma or ovarian carcinoma patients. b. Representative histogram (left) and quantification of the gMFI (middle) and frequency (right) of CD25 expression on NKp46+ILC3s. c. Heatmap showing the log2 fold change in gMFI of indicated parameters between circulating and tumor-infiltrating NKp46+ILC3s. Circulating NKp46+ILC3s from healthy donors set as the reference. Asterisk denotes statistical significance between circulating and tumor-infiltrating groups. d. Representative histograms (top) and quantification of the gMFI (middle) and frequency (bottom) of (from left to right) ICOS, TIGIT, PD-1 and LAG3 expression on NKp46+ILC3s. FMO controls are shown in light gray. a,b,d. Data show mean+SEM. Each dot represents one sample. Statistical analyses were performed using one-way ANOVA followed by a Tukey’s multiple comparisons test. *p < 0.05; **p < 0.01; ***p < 0.001; ns, not significant.
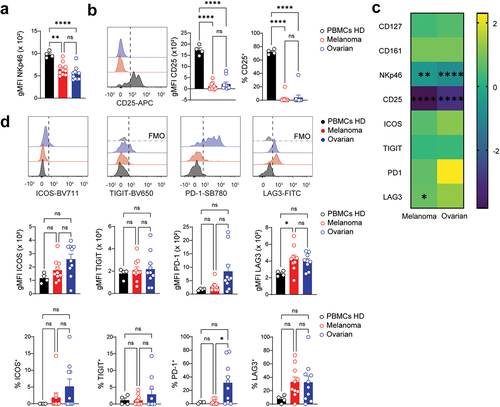
Figure 7. Ovarian carcinoma tumors are enriched in PD-1 expressing T cells, CD8+TRM and cDC1. a-c. Frequency of circulating and tumor-infiltrating (a) b cells, (b, from left to right) CD3+ T cells, γδ+T cells, CD4+ T cells, CD8+ T cells, and (c) Foxp3+ regulatory T cells (tregs). Populations were identified as shown in supplementary figure S2A. d. Representative flow-cytometric color plots (left) and frequency (right) of circulating and tumor-infiltrating CD8+TRM cells. e. Representative flow-cytometric histograms (left) and frequency (right) of PD-1 expression in circulating and tumor-infiltrating (from left to right) CD4+ tconv, CD4+ tregs and CD8+ T cells. f. Frequency of circulating and tumor-infiltrating macrophages (left) and conventional CD103+ cDC1 (right), as identified in supplementary figure 3, are shown. g. Correlation between the frequency of intratumor cDC1 and CD8+ TRM cells in melanoma and epithelial ovarian samples. (left) comparison of the frequency of tumor-infiltrating cDC1+ relative to tumor-infiltrating CD8+ TRM cells. The linear regression curve was overlaid. Dots are colored according to tumor type with blue and red representing respectively ovarian carcinoma and melanoma samples. (right) scatter plot depicting the expression levels of log2 FPKM(CLEC9A) (X-axis) and log2 FPKM(CD8A) (Y-axis) in melanoma (red) or ovarian (blue) cancer samples. A-F. Data show mean±SEM. Each dot represents one sample. Statistical analyses were performed using (A-F) unpaired Student’s t-test or (G) Spearman correlation test. *p < 0.05; **p < 0.01; ns, not significant.
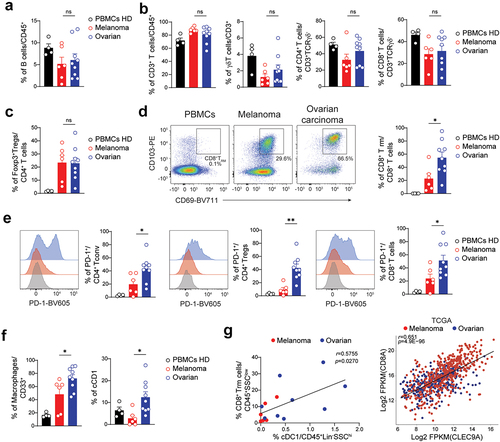
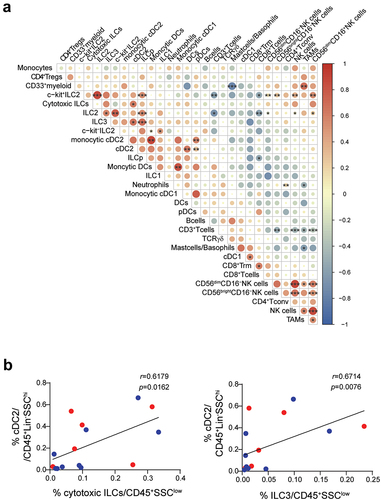
Figure 8. Frequency of tumor-infiltrating cytotoxic ILC3s and NKp46+ILC3s correlate with cDC2 infiltration. a. Correlation plot showing Spearman rho between indicated immune cell subsets. Positive and negative correlations are shown in red and blue, respectively, and the size of the circle provide indications on the strength of detected associations between two variables. Asterisk denotes statistical significance between indicated subsets and represents adjusted p-values using Spearman‘s rank correlation coefficient. Blood samples were excluded from this analysis. b. Comparison of the frequency of tumor-infiltrating cDC2+ relative to tumor-infiltrating cytotoxic ILCs (left) or NKp46+ILC3s (right). The linear regression curves were overlaid. Dots are colored according to tumor type with blue and red representing respectively ovarian carcinoma and melanoma samples. Each dot represents one sample. Statistical analyses were performed using Spearman correlation test. *p < 0.05; **p < 0.01; ***p < 0.001; ns, not significant.
Chung et al Revised figure S2.tif
Download TIFF Image (35.5 MB)Chung et al Revised figure S4.tif
Download TIFF Image (34.5 MB)Chung et al Revised figure S3.tif
Download TIFF Image (27.3 MB)Chung et al Revised figure S1.tif
Download TIFF Image (16.6 MB)Chung et al Revised figure S5.tif
Download TIFF Image (26 MB)Data availability statement
The authors confirm that the data supporting the findings of this study are available within the article and its supplementary materials.