
Figures & data
Table 1. The clinical characteristics of 40 patients (responder: n = 20, non-responder: n = 20) who received anti-PD-1 therapy.
Figure 1. The characterization of T cells with TCRs in the blood.
(a) Experimental design for scRNA-seq. (b) UMAP visualization of 14 cell clusters based on canonical markers and DEGs clustering. Cells are color-coded for clusters. (c and d) UMAP visualization and percentage distribution of clusters for paired blood and tumors. (e) UMAP visualization of TM and non-TM cells in the PB. (f) The top 20 ranked DEGs of TM and non-TM cells in this study and the public GEO dataset. (g) The proportion of TM and non-TM cells among the CX3CR1+ and CX3CR1− T cells in the blood. (h) Proportion of CX3CR1+ in CD3+ T cells (left, gated on CD3+) or CD8+ T cells (right, gated on CD8+) in the blood of patients and HD (n = 6) by flow cytometry. Results are expressed as mean±SD. HD, healthy donor.
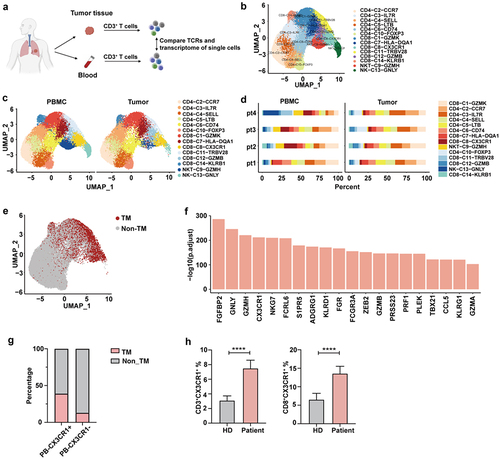
Figure 2. Characterization of tumor-matching T cells in peripheral blood.
(a and b) CX3CR1 expression in CD8+ T cells from paired blood and tumors. (c) The dot plot displays the gene signature in CD8+CX3CR1+ or CD8+CX3CR1− cells derived from PBMC (left) and tumor (right). (d) Statistics of differences in activation and exhaustion signatures between CD8+CX3CR1+ and CD8+CX3CR1− cells. (e) Volcano plots show differentially expressed genes between CD8+CX3CR1+ and CD8+CX3CR1− T cells. Red dots represent significantly upregulated genes in CX3CR1+ T cells (|log2(FC)| > 1). (f and g) Gene Ontology (GO) pathway analysis for DEGs of CD8+CX3CR1+ and CD8+CX3CR1− T cells revealed T cell activation-related pathways and mitochondrial function-related pathways.
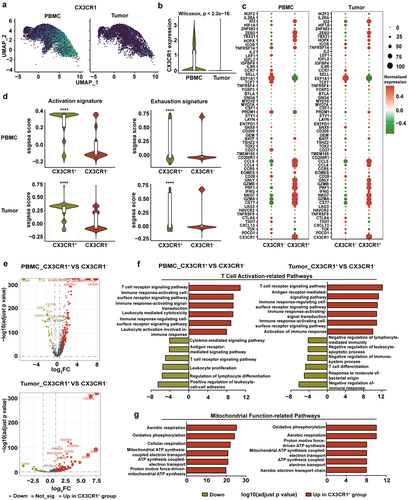
Figure 3. Peripheral CX3CR1+ T cells exhibit properties of activated effector cells.
(a and b) Phenotypic analysis of CD3+CX3CR1+ (left, gated on CD3+) or CD8+CX3CR1+ T cells (right, gated on CD8+), compared with that of the corresponding CX3CR1− subset. (a) shows the percentage of initial PBMC derived from patients, and (b) shows the percentage of CD3+ T cells from patients after 3 days culture. (c, d and e) The production of intracellular cytokines in the above cells. (f) Detection of MM and MMPlow of CD8+CX3CR1+ and CD8+CX3CR1− cells in PBMC from patients by flow cytometry. (g and h) Detection of mitochondrial area of CX3CR1+ and CX3CR1− T cells sorted from PBMC by transmission electron microscopy. (g) Scale bar, 500 nm. (h) using Image-Pro Plus 6.0 software with a 10k 1.0 μm ruler as the reference, multiple mitochondria were selected from each image to measure their area (μm2). (i) Detection of oxygen consumption rate of CX3CR1+ and CX3CR1− T cells sorted from PBMC by Seahorse. Results are expressed as mean±SEM.
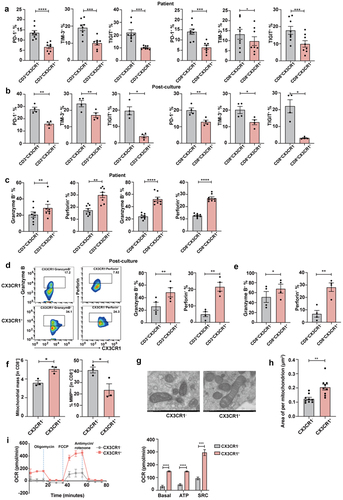
Figure 4. CX3CR1+ T cells display robust anti-tumor reactivity ability and decrease Fas-mediated apoptosis by anti-PD-1 antibody.
(a) Experimental design for cytotoxicity assay in vitro. (b-d) PB CD3+CX3CR1+, CD3+CX3CR1−, and TILs were co-cultured with autologous (b), allogeneic tumor cells (c), and H322 (d) for 24 h (E:T = 5:1); the lysis ratio of tumor cells (gated on CD326) and frequency of T cells expressing CD107a and granzyme B were detected by flow cytometry. Results are expressed as mean±SEM. (e) Volcano plots show differentially expressed genes of CX3CR1+ T cells from PBMC and Tumor. (f) Lists of top 10 KEGG pathways for DEGs of CD8+CX3CR1+ from the PB and tumor tissue. (g) The log2FC indicate no significant differences in chemokine expression levels between CD8+CX3CR1+ and CD8+CX3CR1− cells in both PBMC and tumor. (h) The frequency of T cells expressing Fas was detected by flow cytometry. (i and j) The apoptosis of T cells and the FasL MFI of H322 were detected by flow cytometry. MFI, Mean Fluorescence Intensity. (k) The expression of Fas and cleaved caspase-3 in T cells from different groups was detected by western blot.
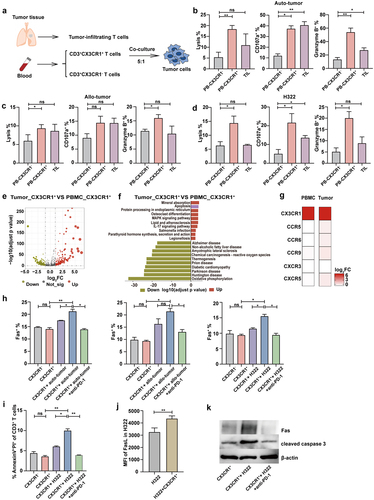
Figure 5. Combination therapy with CX3CR1+ T cells and anti-PD-1 therapy in lung cancer mouse model.
(a) Animal experimental design for detecting the killing function of adoptively transferred CX3CR1+ T cells. (b and c) Detection of mitochondrial area of CX3CR1+ and CX3CR1− T cells sorted from CD45.1 OT-I mice spleens by transmission electron microscopy. (b) Scale bar, 500 nm. (c) using Image-Pro Plus 6.0 software with a 10k 1.0 μm ruler as the reference, multiple mitochondria were selected from each image to measure their area (μm2). (d) Phenotypic analysis of T cells from tumor gated on CD45.1+. (e and f) The production of intracellular cytokines in T cells from spleen and tumor. Gated on CD45.1+. (g) Animal experimental design for detecting the anti-tumor ability of adoptively transferred OT-I T cells combined with anti-PD-1 therapy. (h) The frequency of adoptively transferred T cells in spleen and tumor expressing Fas was detected by flow cytometry. (i – k) Tumor growth curves and survival curves in different treatment groups (n = 5 mice per group). Results are expressed as mean±SEM. (l) The toxicity of adoptively transferred T cells on the heart, lungs, and kidneys was detected by hematoxylin-eosin staining (H&E). Scale bar, 50 μm.
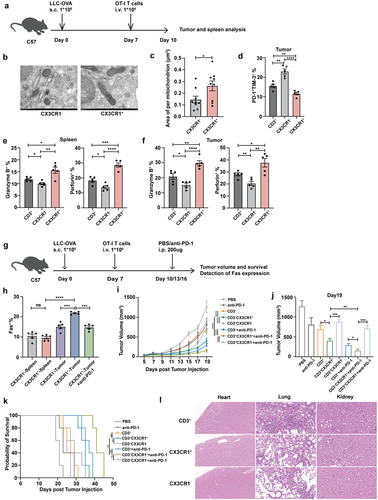
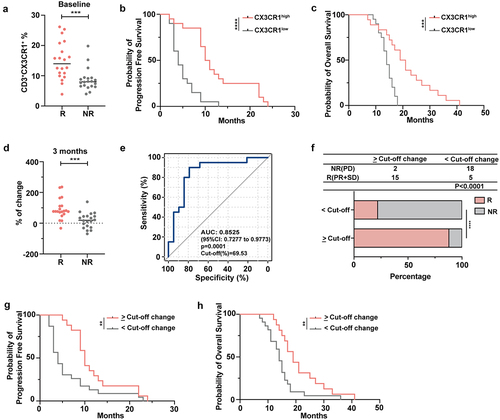
Figure 6. The frequency of circulating CX3CR1+ T cells correlates with effective ICI therapy.
(a) Baseline expression of CX3CR1 on peripheral CD3+ T cells in patients who responded or did not respond to anti-PD-1 therapy. (b and c) CX3CR1 expression levels were associated with OS and PFS in patients with lung cancer treated with anti-PD-1 antibody. Using a logistic regression model, we obtained the AUC and corresponding CI and determined the optimal cutoff value (9.5%) for CX3CR1 expression level. (d) Percent of change in CX3CR1 expression level after anti-PD-1 treatment (change = (after-baseline)/baseline). (e) ROC curve for the correlation between the change in the expression of CX3CR1 and the prognosis of patients treated with anti-PD-1 antibody. (f – h) The samples were divided into two groups based on the cutoff value in (e) (69.53%), the proportion of R and NR patients was compared in each group, as well as their OS and PFS.
Supplemental material