
Figures & data
Figure 1. Landscape of the CAF composition in LCBM.
(a) Schematic diagram of this study. (b) Uniform Manifold Approximation and Projection (UMAP) plots of cells from 32 patients across all metastatic stages, which are grouped into eight major cell types. (c) Dot plot of canonical marker genes for nine major cell types by mean expression. (d) Cell composition proportions of patients with different metastasis status (i.e., tLung, tL/B, mLN, mBrian). (e) Proportion of nonmalignant cells (left) and CAFs (right) relative to the total cell count in different patients, stratified by metastatic status, p-values are calculated by t-test. *p value < 0.05, ns: not significant. (f) UMAP plots of cells from the “CAF” cluster, which are reclustered into eight major cell types. (g) Dot plot of canonical marker genes for four major CAF types by mean expression. (h) Illustration of canonical marker genes and enrichment analysis of all marker genes in each CAF subtype with Metascape database. (i) Representative mIF images of different kinds of CAFs, arrows highlight cells of interest. Scale bars, 50 μm.
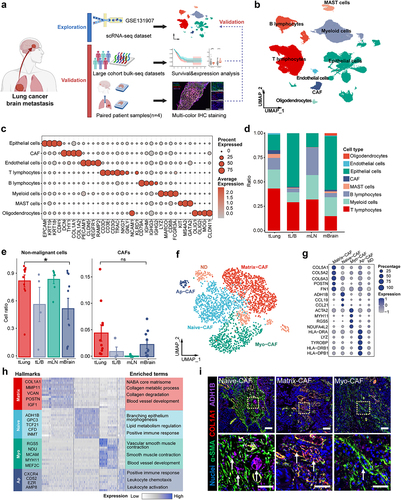
Figure 2. mIF images of paired lung cancer primary/brain metastasis samples.
(a) Left: UMAP plots of cells at primary state (tLung) and brain metastatic state (mBrain). Right: Cell composition proportions are compared between tLung and mBrain. (b) Proportion of Naive-CAF (left), Matrix-CAF (middle), and Myo-CAF (right) relative to the total CAF count in LCBM, p-values are calculated by t-test. *p value < 0.05, **p value < 0.01, ns: not significant. (c) Representative mIF images of nuclei (blue), α-SMA (red), COL1A1 (green), and ADH1B (purple) in lung cancer primary site (tLung), Scale bars: both 100 μm. (d) Representative mIF images of nuclei (blue), α-SMA (red), COL1A1 (green), and ADH1B (purple) in paired brain metastasis site (mBrain), Scale bars: both 100 μm. (e) Violin plot showing different cell proportions of Matrix-CAF, Myo-CAF, and Naive-CAF between lung cancer primary site and brain metastasis, the p values are calculated by the unpaired t-test. mBrain: lung cancer brain metastasis. (f) Kaplan – Meier curves for overall survival in TCGA LUAD patients according to Matrix-CAF/Naive-CAF ratio. HR, the p-value is calculated by the log-rank test, HR, hazard ratio.
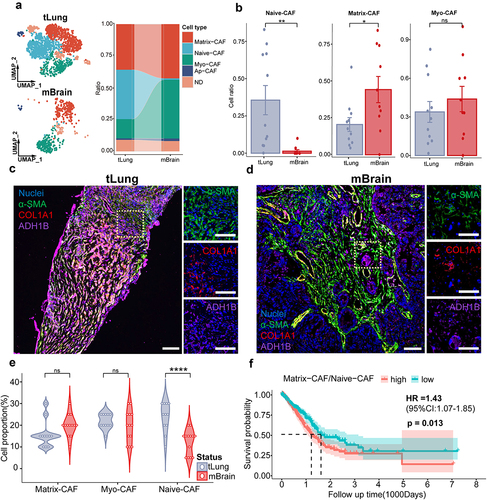
Figure 3. The lineage transition of CAFs in LCBM is associated with hypoxia.
(a) Top: Unsupervised trajectory of Naive-CAF, Matrix-CAF, and Myo-CAF, colored by pseudotime. Bottom: Expression level of ADH1B (a marker of Naive-CAF), ACTA2 (a marker of Myo-CAF), and COL1A1 (a marker of Matrix-CAF) along pseudotime. (b) Trajectory colored by cell type (up), EMT score (middle), and HIF1A-Glycolysis score (bottom). (c) Branched heatmap of differentially expressed genes between Branch A and Branch B with GO BP annotation of enriched terms of all function modules. (d) UMAP plots of cells from the “CAF” cluster, which are colored in accordance with the hypoxia hallmarks enrichment score. (e) Box plot of hypoxia hallmarks enrichment score between lung cancer primary site and LCBM, p-value is calculated by t-test. *p value < 0.05, **p value < 0.01, ***p value < 0.001, ****p value < 0.0001, ns: not significant. (f) Box plot of hypoxia hallmarks enrichment score between different kinds of CAFs, p values are calculated by one-way anova test. (g) Expression level of HIF1A and HIF2A between primary lung cancer and brain metastasis site among all CAF types. (h) Box plot of HIF-1α (left) and HIF-2α (right) pathway enrichment scores between primary lung cancer and brain metastasis site, p values are calculated by t-test. (i) Expression level of HIF1A and HIF2A along pseudotime on Branch A and B. (j) Box plot of HIF1A and HIF2A expression level between different LCBM status of merged datasets comprising GSE112996 and GSE141685 (left) and DFCI metastatic melanoma cohort (right). nonBM: lesions outside brain parenchymal, BM: brain metastasis. p values are calculated by the Wilcox test. (k) (Left) Representative H&E and IHC images showing paired samples of lung cancer primary lesion and brain metastasis lesion from the same patient, tLung: primary lung cancer, mBrain: lung cancer brain metastasis, scale bar: 100 μm. (Right) Violin plot showing IHC scores of HIF-1α and HIF-2α in lung cancer primary site and brain metastasis, the p values are calculated by the unpaired t-test.
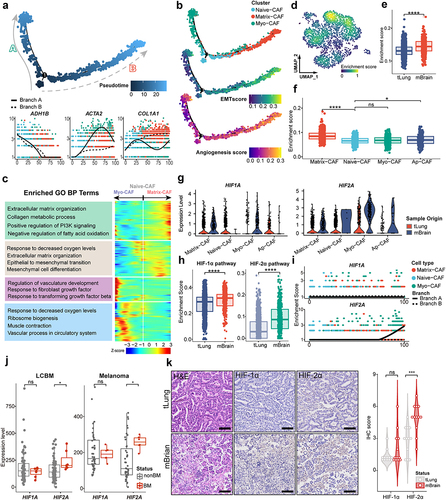
Figure 4. Hypoxia-induced HIF-2α activation drives lineage transition of CAFs.
(a) Violin plot shows the expression level of HIF1A and HIF2A between primary lung cancer (tLung) and brain metastasis (mBrain), comparison was also made between groups by t-test. *p value < 0.05, **p value < 0.01, ***p value < 0.001, ****p value < 0.0001, ns: not significant. (b) Representative multiplex immunofluorescence (mIF) images of nuclei (blue), α-SMA (green), HIF-1α (purple), and HIF-2α (red) in lung cancer primary (up) and brain metastasis (bottom) sites, Scale bars: 100 μm. (c) Dot plot of most relevant modules to primary lung cancer and brain metastasis. (d) Box plot of HIF-2α pathway enrichment scores between primary lung cancer and brain metastasis site among all CAF types, p values are calculated by t-test. (e) RSS plot of most relevant modules to different CAF types. (f) Feature plot of HIF-2α and SIX1 modules in primary lung cancer and brain metastasis. (g) Core regulation network for HIF-2α and SIX1 modules related to Vessel development and ECM organization.
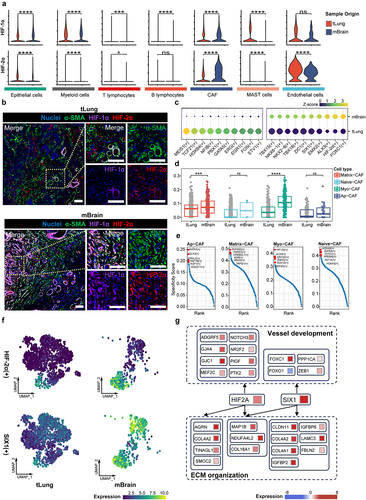
Figure 5. Transited CAFs in LCBM interact with TME and malignant cells.
(a) Changes of interaction numbers during brain metastasis among CAFs, endothelial cells, and epithelial cells. Specific numbers of changes are also presented. (b) Bubble plot of L-R pairs with increased communication probability during NSCLC brain metastasis. (c) Violin plot shows the expression level of PIGF and VEGFR1 between primary lung cancer (tLung) and brain metastasis (mBrain) among different cell types. (d) left: Representative mIF images of nuclei (blue), α-SMA (green), PanCK (white), and CD31 (red) in lung cancer primary site (up) and paired brain metastasis site (bottom), Scale bars: 100 μm. right: Violin plot showing the percentage of Myo-CAF (green)/Endothelial cells (red) overlap between lung cancer primary site and brain metastasis, the p values are calculated by the unpaired t-test. (e) Relative information flow from CAFs to macrophages in LCBM. (f) String diagram of SPP1, PTN, CCL signal pathway in LCBM. The most significant L-R pairs are labeled below. (g) Branched heatmap of differentially expressed genes between Branch A and Branch B with Metascape annotation of enriched terms of all function modules. (h) Violin plot shows the expression level of CCL3, BMP1, and FAP between primary lung cancer (tLung) and brain metastasis (mBrain) among different cell types. (i) left: UMAP plots of CytoTRACE stemness score for all malignant cells. middle: UMAP plots of identified CSCs at primary state (tLung) and brain metastatic state (mBrain). right: Comparison of CSC proportion at primary state (tLung) and brain metastatic state (mBrain), *p value < 0.05. (j) Metascape enrichment of upregulated pathways of CSCs in LCBM. (k) SCAP analysis of metabolic pathways in Matrix-CAF between lung primary site and brain metastasis. (l) Representative mIF images of nuclei (blue), COL1A1 (green), and α-SMA (red) on samples of TKI treatment-naive and TKI treatment-resistant patients, Scale bars: 100 μm. (m) Violin plot showing the percentage of Myo-CAF in TKI naïve and resistant cases, **p value < 0.01.
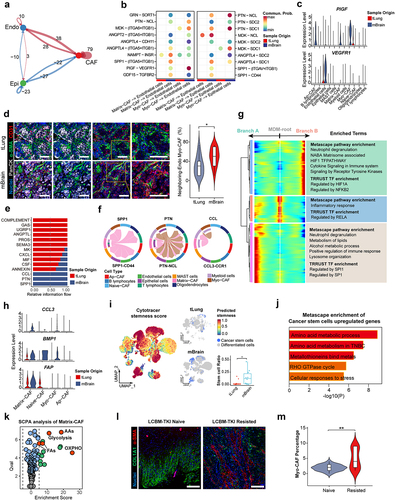
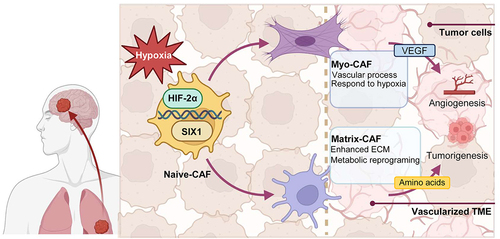
Figure 6. Lineage transition of CAFs in LCBM.
Hypoxia-induced HIF-2α activation drives distinctive lineage transition from Naive-CAF to Myo-CAF and Matrix-CAF during LCBM. Transited CAFs could boost tumor cell proliferation, induce metabolic reprogramming, and promote angiogenesis.
Supplemental material
Supplemental Material
Download Zip (2.2 MB)Data availability statement
Raw data of all datasets analyzed in this paper are publicly accessible and can be assessed according to the method given in the paper.