
Figures & data
Figure 1. Multiomics analysis reveals an altered metabolic profile in BM-DCs expressing dysfunctional β2-integrins (a) Analysis of publicly available gene expression data of resident and migDCsCitation6 for genes involved in cell migration, adhesion and cellular metabolism. (b) Analysis of downregulated pathways in previously published RNA-Seq data from β2-integrin KI BM-DCsCitation7 using the DAVID bioinformatics tool. (c) Targeted mass spectrometry-based analysis of metabolites in WT and β2-integrin KI BM-DCs was performed as described in the Materials and methods section (n=4). (d) Metabolite set enrichment analysis (MSEA) of metabolites identified in WT and β2-integrin KI BM-DCs using the publicly available MetaboAnalyst platform. e) Levels of central metabolites identified by mass spectrometry (normalized concentration e.g. log10). (f) Integrated RNA-Seq and metabolomics data analysis to identify most highly affected metabolic pathways was performed using the MetaboAnalyst platform. P-values are shown as <0.05*, <0.01**.
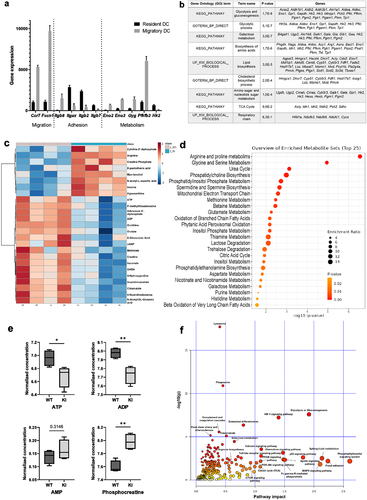
Figure 2. β2-integrin deficient BM-DCs display altered metabolic profile compared to BM-DCs with functional integrins. (a) Extracellular acidification rate (ECAR) and (b) oxygen consumption rate (OCR) of WT and β2-integrin KI BM-DCs were measured real time by utilizing Seahorse Extracellular Analyser and Mito Stress Test Kit (n=4). (c) Parameters indicating mitochondrial function in WT and β2-integrin KI BM-DCs were calculated based on OCR data shown in B). (d) ATP/ADP ratio in WT and β2-integrin KI BM-DCs was determined with luminescence-based ADP/ATP Ratio Assay Kit (n=3). (e) Metabolic activity of both WT and β2-integrin KI BM-DCs was assessed flow cytometrically by determining the level of puromycin incorporation. Harringtonine (translation inhibitor)-treated cells were used as a negative control and the result is normalized to the metabolic activity of WT cells. (n=3). Cell viability was assessed flow cytometrically (n=3). (g) Level of mitochondrial DNA (mtDNA) in WT and β2-integrin KI BM-DCs was assessed by qRT-PCR (n=3). (h) Mitochondrial membrane potential (MMP) and H) the level of reactive oxygen species (ROS) in WT and β2-integrin KI BM-DCs were assessed by flow cytometer with representative dot plots (h) or histograms (i), MFIs and proportions of positive cells shown (n=3). Data in a) and b) is representative of two independent experiments. Data in h) is either shown as representative of two independent experiments (dot plots and MFI) or pooled from the two independent experiments (proportions of positive cells). P-values are shown as <0.05*, <0.0001****.
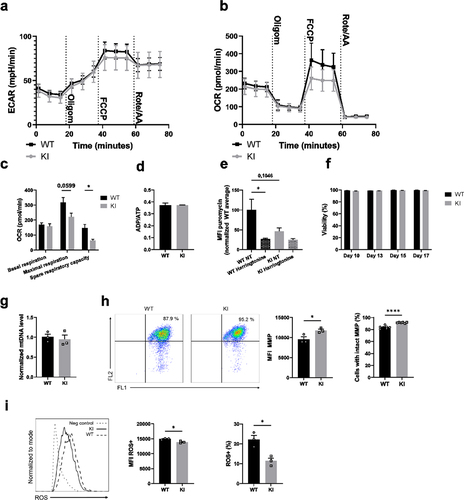
Figure 3. β2-integrin-deficient BM-DCs display reduced expression of glycolytic enzymes and glucose transporters as well as reduced glucose uptake. (a) Expression of Pfkl, Pkm, Hif1α and Phd3, b) protein level of Glut1 and c) glucose uptake in WT and β2-integrin KI BM-DC were determined by using a) qRT-PCR (n=3–5), (b) Western blotting (n=5) or (c) luminescence-based Glucose Uptake-Glo™ Assay kit (n=4) as described in the Materials and Methods. P-values are shown as <0.05*, <0.01**.
Figure 4. mTOR pathway is not responsible for the altered metabolic profile of β2-integrin KI BM-DCs. The activity of a) mTOR and b) AMPK pathways in WT and β2-integrin KI BM-DCs were assessed by Western blotting of (a) pAkt, phopho-p70S6K and b) pAMPKα (Thr172) (n=3–4). (b) for pAMPKα (Thr172), both the blot and quantification of the result are shown. (c) iNOS expression in WT and β2-integrin KI BM-DCs was determined by qRT-PCR in the presence or absence of rapamycin (n=3). (d) ECAR and e) OCR in β2-integrin KI BM-DCs, in the presence or absence of rapamycin, were analysed by Seahorse Extracellular analyser with a Mito Stress Test Kit (n=4) and (f) parameters of mitochondrial respiration were calculated from rates of oxygen consumption shown in (e). (g) ELISA was used to assess IL-12 production in WT and β2-integrin KI BM-DCs in the presence or absence of rapamycin. Data in g) is pooled from six (WT vs. KI) or four (KI vs. KI rapa) independent experiments. p-values are shown as <0.05*, <0.01**, <0.005***.
Figure 5. Transcription factor Ikaros has a key role in regulating β2-integrin-deficient BM-DC metabolism. (a) Comparison of genes repressed by Ikaros and genes being downregulated in β2-integrin KI BM-DCs. Here, the Ikaros-regulated genes are taken fromCitation27 and the genes being downregulated in β2-integrin KI cells are based on RNA-Seq expression data.Citation18 GO-analysis result of the 64 intersect genes are also listed in a). (b) Ikaros levels in WT and β2-integrin KI BM-DCs was assessed by Western blotting (n=3). (c) ECAR and d) OCR in β2-integrin KI BM-DCs in the presence or absence of lenalidomide was assessed by Seahorse Extracellular Analyser with Mito Stress Test Kit as described in Materials and Methods (n=3). (e) Parameters of mitochondrial respiration were calculated based on OCR data shown in d). P-values are shown as <0.05*, <0.01**.
Figure 6. Inducing metabolic stress with low-dose 2DG activates BM-DCs. a) WT BM-DCs were treated with different amounts of 2DG, after which CCR7 expression was assessed by flow cytometry. Representative histograms for NT WT and 2.5 mM 2DG-treated WT BM-DCs, MFIs and proportion of CCR7 expressing cells are shown (n=3). b) Production of IL-12 by NT WT, NT β2-integrin KI or 2.5 mM 2DG-treated WT BM-DCs was assessed by ELISA (n=15–16). Data is pooled from five independent experiments. c) mRNA expression of CCR7 and IL-12 in NT WT, NT β2-integrin KI and 2.5 mM 2DG-treated WT BM-DCs, was assessed by qRT-PCR (n=5). d) Migration speed of WT BM-DCs with or without 2.5 mM 2DG-treatment in a 3D collagen matrix in response to a CCL19 gradient was assessed as described in the Materials and Methods (n=3 mice, a total of 267 WT and 346 2DG-treated WT cells were tracked). e) Histone methylation of H3K4me3 and H3K27me3 in NT WT and 2DG-treated WT BM-DCs was assessed by Western blotting (n=3). f) T cell proliferation was assessed by MLR by culturing CD4 T cells with NT or 2.5mM 2DG-treated BM-DCs. p-values are shown as <0.05*, <0.01**, <0.005***, <0.0001****.
Figure 7. Metabolic suppression improves BM-DC-mediated anti-tumor responses in vivo. a) Experimental design of the tumor experiment. b) Growth of B16-OVA melanoma tumors before and after peritumoral injection of PBS (Mock), non-treated (NT) WT BM-DCs or WT BM-DCs treated with 2.5mM 2DG (n=8 mice per group). Tumor growth was measured every 2 d. c) the fractions of mice with tumor biomass (outgrowth) and no tumor biomass (cure) 20 d after tumor inoculation. d) Individual growth curves of B16-OVA melanoma tumors before and after peritumoral injection of PBS (Mock) (left panel), non-treated WT BM-DCs (middle panel) or WT BM-DCs treated with 2.5mM 2DG (right pane). e) Numbers and proportions of CD4 T cells, CD44+(memory) CD4 T cells, CD69+ (activated) CD4 T cells, CD8 T cells, CD44+ (memory) CD8 T cells and CD69+ (activated) CD8 T cells in tumors, relative to tumor volume were determined flow cytometrically.
Supplemental Material
Download MS Word (507.7 KB)Data availability statement
Metabolomics data for this study were generated at the Institute for Molecular Medicine Finland (FIMM), University of Helsinki, Finland, and are available from the corresponding author upon request. All other data generated in this study are also available upon request from the corresponding author.