
Figures & data
Figure 1. Structure of αCD25-CyPeg-Duo and cytotoxic mechanism of CD25-targeted NIR-DPR. (a) structure of αCD25-CyPeg-Duo. The N,N’-diethylethylenediamine linker is cleaved with 780 nm hv. (b) cytotoxic mechanism of CD25-targeted NIR-DPR. After binding of αCD25-CyPeg-Duo to CD25 on the surface of CD25-expressing cells, it is internalized into the cytoplasm. Light irradiation at 780 nm triggers payload uncaging, which results in apoptosis of CD25-expressing cells.
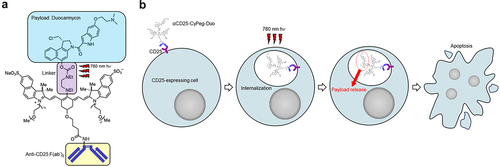
Figure 2. CD25-targeted NIR-DPR showed cytotoxic effects on CD25-expressing cells in vitro and Tregs ex vivo.
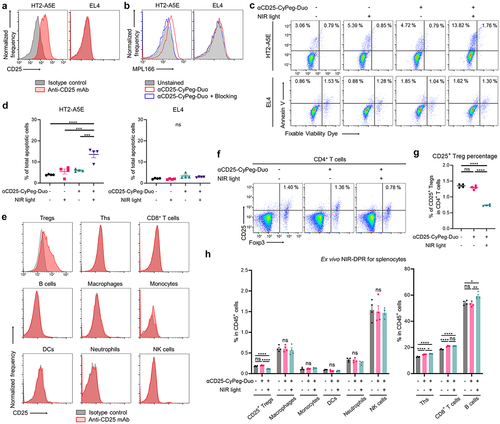
Figure 3. Delivery and biodistribution of intravenously administered αCD25-CyPeg-Duo in vivo.
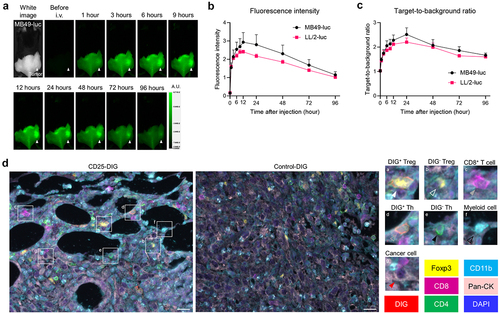
Figure 4. In vivo therapeutic efficacy of CD25-targeted NIR-DPR in a MB49-luc tumor mouse model.
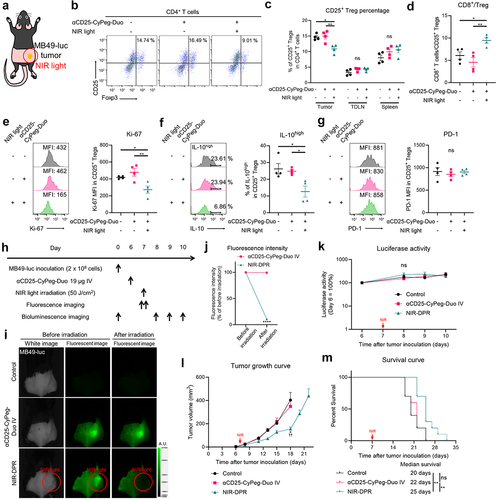
Figure 5. In vivo therapeutic efficacy of CD25-targeted NIR-DPR combined with PD-1 blockade.
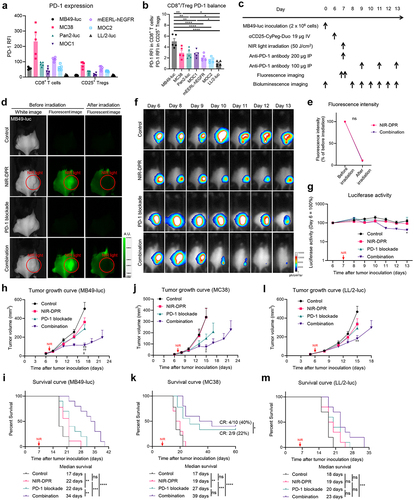
Figure 6. Early host immune responses to CD25-targeted NIR-DPR combined with PD-1 blockade in a MB49-luc tumor mouse model.
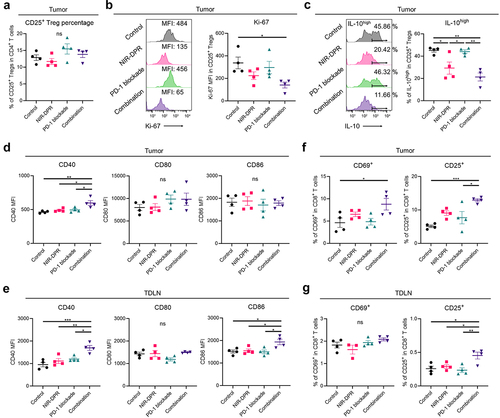
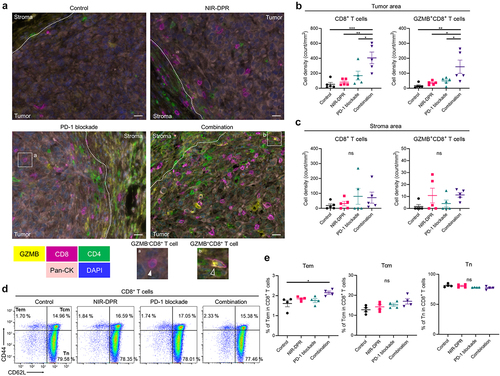
Figure 7. Enhanced anti-cancer immunity was successfully established after CD25-targeted NIR-DPR combined with PD-1 blockade in a MB49-luc tumor mouse model.
Supplementary Data_Oncoimmunology R1.docx
Download MS Word (9.9 MB)Data availability statement
The data that support the findings of this study are available from the first or corresponding author, [HF or HK], upon reasonable request.