
Figures & data
Figure 1. Correlation of increased patients’ overall survival with reduced hnRNP C expression in different cancer types including melanoma.
The OS probability of melanoma patients with Kaplan–Meier estimation over time depending on hnRNP C expression including (A) 44 cases metastasis melanoma patients and (B) 459 cases from “SKCM Cancer” dataset, both analyzed from R2 web database (https://hgserver1.amc.nl/cgi-bin/r2/main.cgi) is shown. (C) Correlation of the expression of hnRNP C with the OS in several cancer via TCGA dataset using R2 web tool is demonstrated and presented as overall survival probability (ACC: adrenocortical carcinoma, CESC: cervical squamous cell carcinoma and endocervical adenocarcinoma, ESCA: esophageal carcinoma, KIRC: kidney renal clear cell carcinoma, KIRP: kidney renal papillary cell carcinoma, LUAD: lung adenocarcinoma, PAAD: pancreatic adenocarcinoma, SARC: sarcoma).
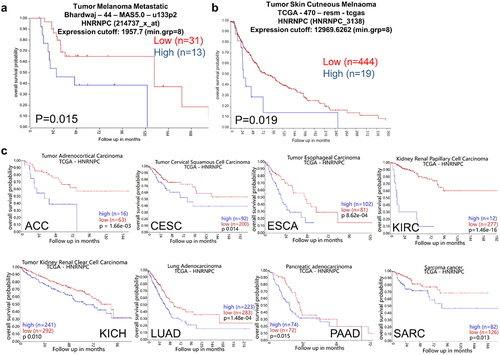
Figure 2. Higher hnRNP C expression levels in tumor samples compared to paired tumor adjacent samples in pan-cancer.
The expression of hnRNP C mRNA levels in tumor tissues and paired normal tissues was compared in 31 TCGA cancer datasets including melanoma via the GAPIA web tool (Each dots represent expression of samples. Log Scale: using log2(TPM +1) transformed expression data for plotting). (BLCA: bladder urothelial carcinoma, BRCA: breast invasive carcinoma, CHOL: cholangiocarcinoma, COAD: colon adenocarcinoma, DLBC: lymphoid neoplasm diffuse large B cell lymphoma, GBM: glioblastoma multiforme, HNSC: head and neck squamous cell carcinoma, KICH: kidney chromophobe, LAML: acute myeloid leukemia, LGG: brain lower grade glioma, LIHC: liver hepatocellular carcinoma, LUSC: lung squamous cell carcinoma, OV: ovarian serous cystadenocarcinoma, PCPG: pheochromocytoma and paraganglioma, PRAD: prostate adenocarcinoma, READ: rectum adenocarcinoma, SKCM: skin cutaneous melanoma, STAD: stomach adenocarcinoma, TGCT: testicular germ cell tumors, THCA: thyroid carcinoma, THYM: thymoma, UCEC: uterine corpus endometrial carcinoma, UCS: uterine carcinosarcoma).
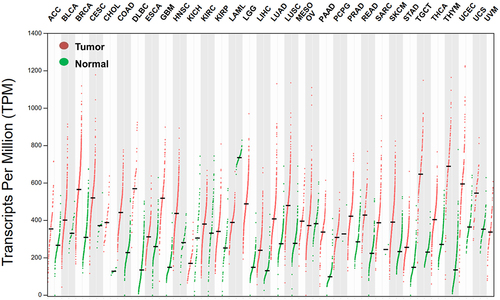
Figure 3. Inverse correlation of hnRNP C and tpn expression in different cancer types.
The link of mRNA expression between hnRNP C and tpn was determined in different cancer types using the TCGA data set via ENCORI web tool (https://rnasysu.com/encori/index.php). Each dot represents mRNA expression levels of a tumor sample. The expression values of these two genes from RNA-seq data were scaled with log2 (FPKM +0.01) and using linear regression and spearman correlation (ACC: adrenocortical carcinoma, CESC: cervical squamous cell carcinoma and endocervical adenocarcinoma, COAD: colon adenocarcinoma, KIRP: kidney renal papillary cell carcinoma, LUAD: lung adenocarcinoma, LUCS: lung squamous cell carcinoma, UCEC: uterine corpus endometrial carcinoma, OV: ovarian serous cystadenocarcinoma, READ: rectum adenocarcinoma, PRAD: prostate adenocarcinoma, THYM: thymoma, BLCA: bladder urothelial carcinoma, SKCM: skin cutaneous melanoma).
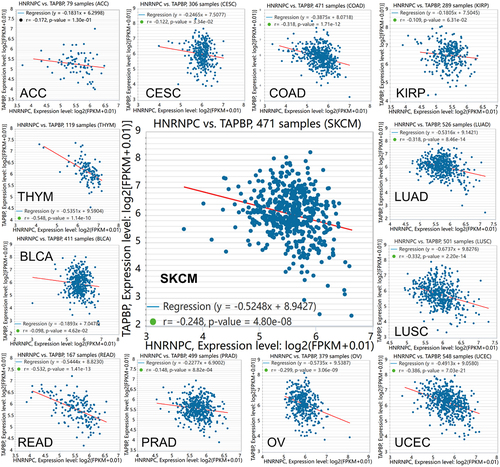
Figure 4. Upregulation of tpn mRNA levels by knockdown of hnRNP C.
RT-qPCR was performed to determine the mRNA expression levels of hnRNP C and tpn as well as other MHC-I-associated molecules in two metastatic melanoma cell lines 48 h after transfection with si-hnRNP C or with a siRNA negative control (NC). The qPCR data were normalized to parental cells without any treatments and presented as mean of relative expression levels ± SD from three independent biological replicates.
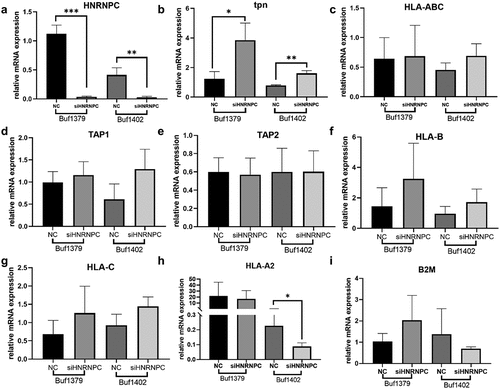
Figure 5. Upregulation of tpn protein levels by knockdown of hnRNP C.
(A-D) The protein expression of hnRNP C, tpn and HLA-I HC was determined 48 h after transfection of Buf1379 and Buf1402 cells with si-hnRNP C or NC using Western blot analysis as described in Methods and Materials. The relative band intensities (A.U., arbitrary units) were compared to parental melanoma cells and normalized to staining with an anti-β-actin Ab (mean ± SD, n = 3 biological replicates). *p < 0.05, **p < 0.01 and ***p < 0.001.
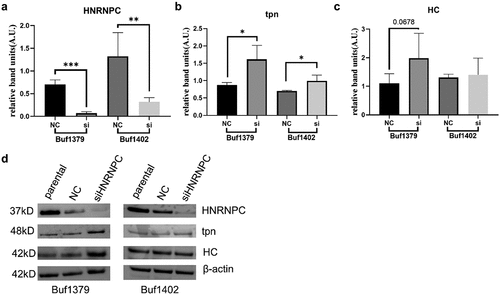
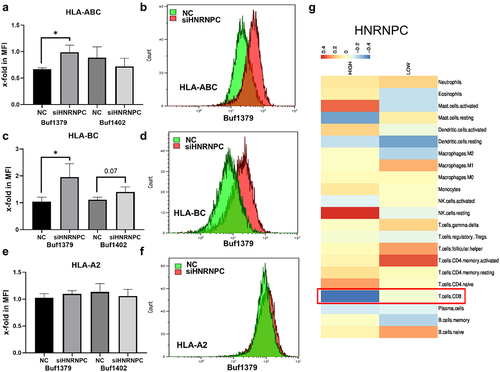
Figure 6. Effect of siRNA-mediated downregulation of hnRNP C on HLA-I cell surface expression and immune cell infiltration.
(A-B) Flow cytometry was performed as described in Methods and Materials to determine the HLA-I surface expression of melanoma cells upon transfection with si-hnRNP C and NC. Melanoma cells were stained with antibodies directed against HLA-ABC and HLA-BC. The data were presented as x-fold change in the mean fluorescence intensity (MFI) to parental cells (mean ± SD, n = 3 biological replicates). (C) The 67 metastatic melanoma cases divided into hnRNP Chigh and hnRNP Clow expressors were correlated with the immune cell infiltration via CIBERSORT in TCGA-SKCM dataset. Data are presented in a heat map. *p < 0.05.
Supplemental material
Supplemental Material
Download MS Word (2.2 MB)Data availability statement
All the data are available in the manuscript or the supplementary materials.