
Figures & data
Figure 1. The ADA/CD26 axis provides a higher functional advantage to PD-1+CD28+ T cells, whether as a whole subset or when co-expressing CD39, ADA, and CD26. (a) Representative multicolor flow cytometry plots showing CD26, CD39, CD73, and ADA expression, gated on ex vivo unstimulated PD-1+CD28− and PD-1+CD28+ T-cell subsets from different districts of NSCLC patients; (b) Frequencies of individual CD26, CD39, CD73, and ADA expression in ex vivo unstimulated PD-1+CD28− and PD-1+CD28+ T cells from peripheral blood (P), distal non-tumor tissue (NT), and tumor site (T); (c) Comparison of the frequencies of subpopulations with distinctive CD39, ADA, and CD26 co-expression, between ex vivo unstimulated PD-1+CD28− and PD-1+CD28+ T cells from P, NT, and T; (d) IFN-γ, TNF-α, and GrzB production by subgroups with distinctive co-expression patterns of CD39, ADA, and CD26 within PD1+CD28− and PD1+CD28+ T cells from T of NSCLC patients and stimulated by anti-CD3 mAb (5-6h). p values were calculated using the Wilcoxon rank test with Bonferroni correction for multiple comparisons. *p ≤ 0.05, **p ≤ 0.01. Plots show median values with interquartile range.
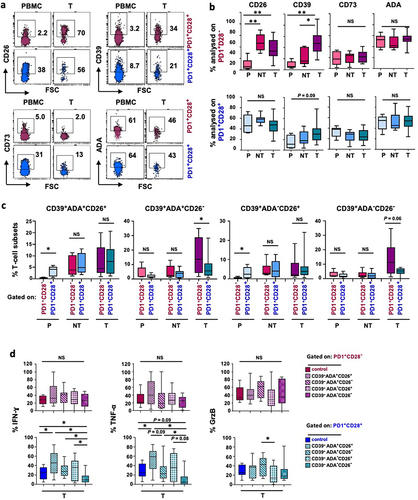
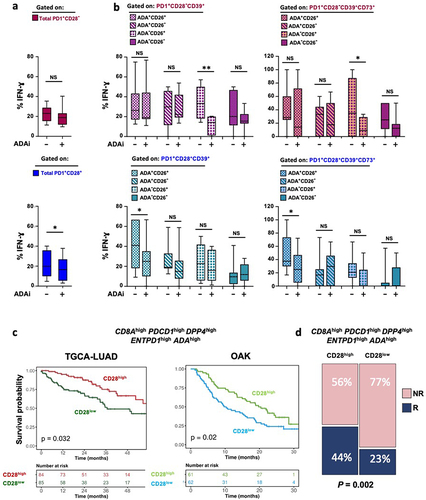
Figure 2. In a CD39-enriched setting, PD1+CD28+ T-cell functionality relies on an autocrine ADA/CD26 axis, which emerges as a predictive signature for OS and responsiveness to ICB. (a-b) Effect of ADA inhibition (ADAi) with the specific inhibitor EHNA on IFN-γ production in T cells isolated from NSCLC tumor sites, stimulated by anti-CD3 mAb (5-6h). ADAi impact was assessed on PD-1+CD28− and PD-1+CD28+ T cells (a) and on subgroups with distinctive co-expression patterns of CD39, ADA, and CD26 (b, left panels) or CD39, CD73, ADA, and CD26 (b, right panels). p values were calculated using the Wilcoxon rank test. *p ≤ 0.05, **p ≤ 0.01. (c) Kaplan-Meier curve showing OS probability of adenocarcinoma patients from the TCGA-LUAD and OAK datasets. Patient numbers at risk and P-values are displayed. Significance was assessed using the log-rank test; (d) Bar plots showing the percentage of patients from the OAK cohort stratified according to the High/Low scores of our signature and categorized as Responders (R) and Non-Responders (NR) to ICB based on CD28high (left panel) and CD28low (right panel) expression. Significance was determined through the Fisher’s Exact test.
Table_S1.docx
Download MS Word (64.8 KB)Fig_S1a.jpeg
Download JPEG Image (366 KB)
Fig_S2b.jpeg
Download JPEG Image (230.9 KB)
Fig_S3.jpeg
Download JPEG Image (142.3 KB)
Fig_S2a.jpeg
Download JPEG Image (197 KB)
Fig_S1b.jpeg
Download JPEG Image (267.5 KB)
Data availability statement
Flow cytometry data that support the findings of this study are available from the corresponding Authors, PN and OF, upon reasonable request. TCGA LUAD dataset was downloaded from https://xenabrowser.net/. OAK dataset was downloaded from https://ega-archive.org/ after a formal request to Genentech.