
Figures & data
Table 1. Characteristics of three patients with single-cell analysis.
Figure 1. Phenotypic and TCR clonal analyses of CD8+ T cells from MPE.
a. Overall scheme of this study. Schema prepared with BioRender.com. b. Uniform manifold approximation and projection (UMAP) of the expression profiles of the 4,983 single CD8+ T cells derived from the 3 MPE. CD8+ T cells are classified into 10 distinct clusters. c. UMAPs of CD8+ T cells in each patient. d. The number of T cells in the 10 clusters of each patient. e. The normalized average expression of phenotypic and functional signatures for CD8+ T cell subpopulations defined in B. f. Pseudotime trajectory analysis of 4,983 CD8+ T cells. Each dot represents one single cell and each cell with a pseudotime score from dark blue to yellow, indicating early and terminal states, respectively. g. Clonality and clone numbers in each cluster for the three patients. h. The rate of overlapping clonotypes among different clusters.
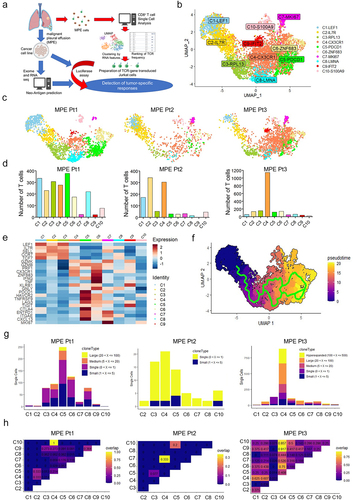
Figure 2. Identification of tumor antigens recognized by CD8+ T cells.
a. Representative data from four separate screenings using 50 TCRs (out of a total 54 TCRs tested) by luciferase reporter assay driven by the NFAT-response element in MPE Pt1. Reactivity of each TCR against six representative pools of peptides (5 peptides/pool) (out of a total 11 pooled). b. Reactivity of the four different TCRs (ex1, ex7, ex12. and ex17) identified in A tested against B-APC pulsed with mutant DOP1B or wild-type peptides at different concentrations. c. Scheme of TCR-transduced γδ T cells co-cultured with the autologous cell line for detection of IFNγ production (left). The results of IFNγ ELISA (right). d. Activation of e×321TCR signaling was assessed against the autologous cell line or other cell lines (LK006 and LK208). The e×321TCR-transduced CD8-J2 cells were also co-cultured with autologous KOM002 with HLA class I-blocking antibody (50, 100 or 200 μg/ml)
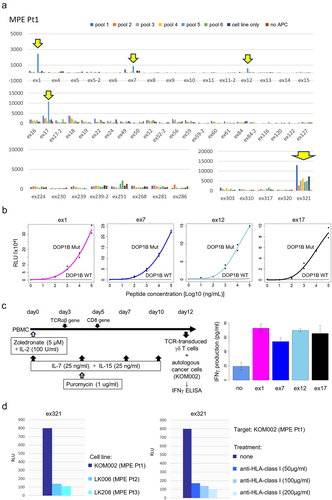
Figure 3. Gene expression analysis of tumor-specific CD8+ T cells from MPE.
a. All identified TCR clones (n = 29) with the five tumor-antigen specific TCRs (ex1, ex7, ex12, ex17, and ex321) were projected onto UMAPs. b. Expression of exhaustion-related genes in each tumor-specific T cell clone. c. Expression of representative genes in tumor-specific T cells expressing different TCRs compared with the other T cells. Comparison of average expressions of tumor-specific T cells and the others was performed using Mann–Whitney U-test. d. Analysis of genes differentially expressed between tumor-specific T cells and other T cells. Volcano plot showing differentially expressed genes with adjusted p value < .01 and log2FC >0.5. e. Fast Gene set enrichment analysis (FGSEA) of tumor-specific T cells and others. The top 20 significant gene sets with adjusted p value < .01 and NES < 7.5 are shown. *, P < .05; **, P < .01; ***, P < .001; ****, P < .0001; ns, not statistically significant.
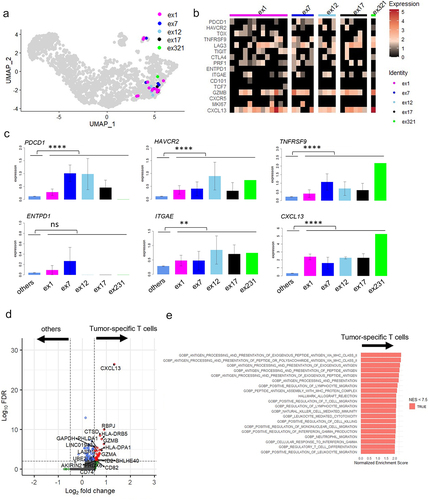
Figure 4. Comparison of tumor specific CD8+ T cells between MPE and TILs.
a. UMAP of the expression profiles of the 11,981 (MPE: 4,983 cells + TILs: 6,998 cells) single CD8+ T cells derived from 3 MPE and 3 TILs.Citation18 CD8+ T cells are classified into 13 distinct transcriptional clusters. b. All tumor-specific TCR clones with the five tumor-specific TCRs from MPE (left) and nine tumor-specific TCRs from TIL (right) were projected onto UMAPs. c. Violin plot showing the expression of representative genes in cluster C6-PDCD1 for 3 MPE and 3 TILs. d. Comparison of the expression of T cell subset-defining genes in tumor-specific T cells expressing TCRs different between MPE and TILs. Comparison of average expressions of tumor-specific T cells from MPE and TILs was performed using Mann-Whitney U-test. E and F. The ratio of tumor-specific T cells in T cell populations expressing a single marker gene (e) or a combination of marker genes (f) in MPE and TILs. *, p < .05; **, p < .01; ***, p < .001; ****, p < .0001; ns, not statistically significant.
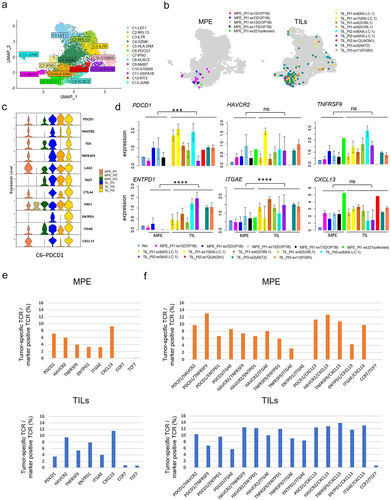
Figure 5. Associations of tumor specific CD8+ T cell fractions in MPE with patients’ prognosis.
a. The expression of PD-1/4-1BB and CXCL13 by CD8+ T cells analyzed by flow cytometry in 69 and 35 patients, respectively, showing higher and lower percentages of their expression for 3 MPE patients (MPE Pt1, MPE Pt2, MPE Pt3). b. Flow cytometric analyses of all patients are shown as bar graphs. c and d. Kaplan–Meier survival curves for patients stratified into two groups by the median values of the expression of PD-1/4-1BB (c) or CXCL13 (d) in all patients and in a subgroup of adenocarcinoma patients.
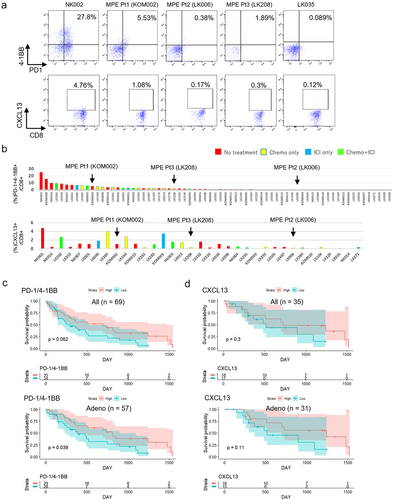
Table 2. Characteristics of patients with flow cytometric analysis.
Supplemental material
Supplementary figure.pdf
Download PDF (1.7 MB)Supplementary table.xlsx
Download MS Excel (74.9 KB)Data availability statement
Data are available upon reasonable request.