
Figures & data
Table 1. Baseline patient characteristics.
Figure 1. Tumor responses.
Response was assessed with Response Evaluation Criteria in Solid Tumors version 1.1 by investigators. (a) Waterfall plot of best percentage change for target lesions by RECIST v1.1 in all eligible patients. PD-L1 status determined by TPS is indicated as described (yellow/plus: positive, purple/horizontal line: negative, gray/X: not evaluated). (b) Spider plot of radiographic response. Tumor responses were measured at regular intervals and values show percent change of sum of longest diameters from the baseline measurement of each measurable tumor. Red diamond-shape indicating patients who progressed due to occurrence of new lesions. Gray diamond-shape indicating patients who exited the trial due to other reasons than disease progression. (c) Swimmer plot of treatment duration. The gray star-shape indicates the time of first response. The arrow indicates patients still on treatment. PD-L1 status determined by TPS is indicated as described (yellow/plus: positive, purple/horizontal line: negative, gray/X: not evaluated). TPS, tumor proportion score.
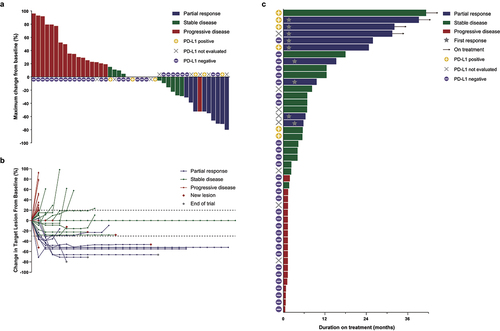
Figure 2. Kaplan-Meier analysis of survival.
(a) Progression-free survival. (b) Overall survival.
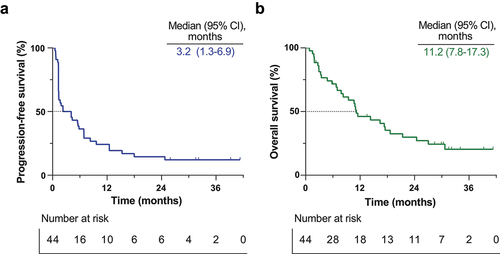
Table 2. Treatment efficacy.
Table 3. Adverse events and treatment-related adverse events.
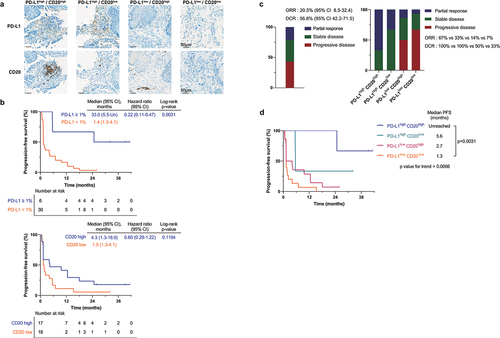
Figure 3. Biomarker analysis.
(a) Representative images (200×) of PD-L1 and CD20 IHC staining. (b) Kaplan-Meier plots of progression-free survival by (top) PD-L1 (TPS) 1% and (bottom) density of CD20-positive immune cell infiltration. CD20 high group defined as CD20-positive immune cell infiltration density higher than the median value. (c) (Left) Overall response rate and disease control rate with proportion of patients by best response. (Right) Overall response rate and disease control rate with proportion of patients by best response subdivided based on PD-L1 expression and CD20-positive immune cell infiltration. (d) Kaplan-Meier plot of progression-free survival of patients subdivided based on PD-L1 (TPS) 1% and density of CD20-positive immune cell infiltration density. IHC, immunohistochemistry; PD-L1, programmed cell death ligand 1; TPS, tumor proportion score.
Supplemental material