
Figures & data
Figure 1. (a) Duration of study participation and efficacy assessment for the per-protocol BRAF-mutant population (experimental group (E), n = 3; control group (C), n = 6). Dynamics of plasma BRAF V600E DNA over the study treatment in (b) two experimental-group subjects and (c) three control-group subjects.
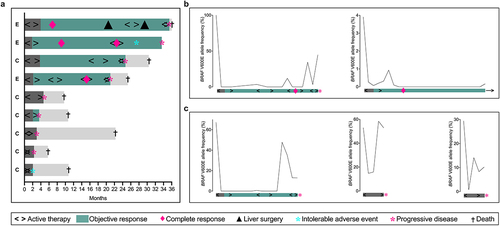
Figure 2. Left framed panel: The primary tumor site; baseline endoscopy and biopsy (top), endoscopy and biopsy at radiologic complete response (bottom). Right framed panel: The metastatic disease; the primary tumor (encircled) and multiple liver metastases at baseline (top), the ascending colon and liver at radiologic complete response (bottom). Further details are displayed in Supplementary Figures S3 and S5.
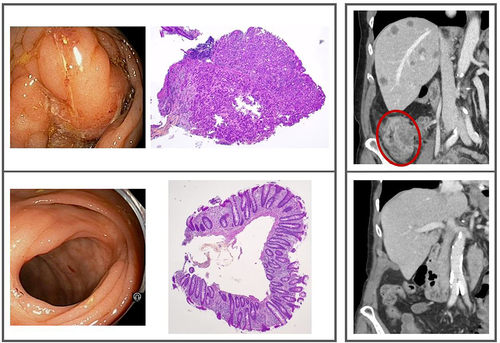
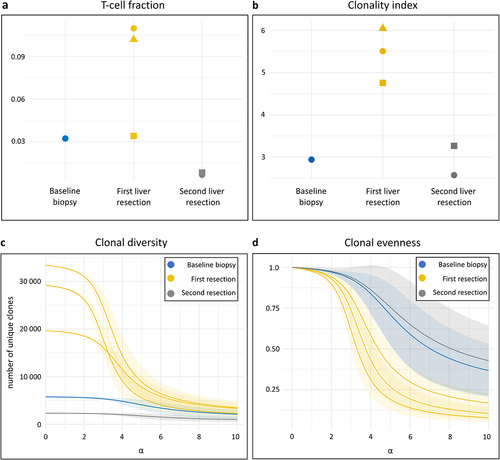
Figure 3. T-cell receptor (TCR) repertoire in sequential liver metastases. TCR sequencing was done on a baseline biopsy sample from one of multiple liver metastases, three samples from the two resected liver metastases that relapsed after the radiologic complete response, and two samples from the resected end-stage liver metastases. (a) T-cell fractions in the repertoire of each sample, stratified by sampling time. The mean number of TCR sequences detected was 22,185 at baseline, 82,263 at the first liver resection, and 7,252 at the second. (b) Repertoire clonality of each sample, stratified by sampling time. The clonality index is defined as 10 minus the area under the curve of the evenness profile, with higher values signifying more monoclonal repertoires. (c) Hill diversity profile and (d) Hill evenness profile for each repertoire, presented by mean (solid line) with 95% confidence interval (shaded area). The left part of the diversity curve (α = 0) represents the number of unique clones present in the repertoire. The further and more rapidly each curve declines at increasing α values, the more uneven is the clonal frequency distribution (more monoclonal repertoires). The evenness profiles represent the diversity profiles normalized by clonal richness in the repertoire.
Suppl Figure S5.docx
Download MS Word (599.9 KB)Suppl Tables.docx
Download MS Word (21.3 KB)Suppl Results.docx
Download MS Word (20.8 KB)Suppl Methods.docx
Download MS Word (21.3 KB)Suppl Figure S3.docx
Download MS Word (2.4 MB)Suppl Figure S4.docx
Download MS Word (1.8 MB)Suppl Figure S6.docx
Download MS Word (582.1 KB)Suppl Figures S1 S2.docx
Download MS Word (110.3 KB)Data availability statement
Requests for data can be made to the corresponding author. The data generated in this study are subject to patient confidentiality in accordance with the General Data Protection Regulation of the European Union, and the transfer of data or materials will require approval from the Data Privacy Officer at Akershus University Hospital and on some occasions from the Regional Committee for Medical and Health Research Ethics of South-East Norway. Any shared data will be de-identified.