
Figures & data
Figure 1. PCa TAA mRNA-LNPs-stimulated immunity suppresses prostate tumor growth in mice.
(a) Schematic structure of TAA and TAA-EGFP mRNAs. TAA-EGFP mRNA was employed to verify mRNA expression efficiency; TAA mRNA was used for both in vitro and in vivo immunological assessments. (b) HEK293 cells were transfected with 1 μg of TAA-EGFP mRNA-LNPs and fluorescence intensity was detected by flow cytometry to verify mRNA expression 24 h after transfection. (c) BMDC maturation and activation levels after different treatments in vitro. Each symbol represented the BMDCs from one mouse transfected with 0.5 μg/ml mRNA-LNP. (d) IFN-γ ELISpot assays were used to detect the release of IFN-γ by spleen cells activated by BMDCs membrane antigens on day 5 after the last TAA mRNA therapeutic treatment in mice. Each dot represented one independent mice. (e) C57BL/6 mice (n = 8) were grafted with 2 × 10⁵ RM-1-PSMA tumor cells and treated with different mRNA therapeutics by intramuscular injection on days 4, 9, 13, 17, and 21. (f and g) Tumor growth (f) and survival (g) of the tumor-bearing mice were observed until all mice died. Data were presented as means ± SEMs. Statistical significance was determined by One-Way ANOVA (b to d), Students t test (f), and Kaplan-Meier survival analysis (g). *P < .05, **P < .01, ***P < .001, and ****P < .0001.
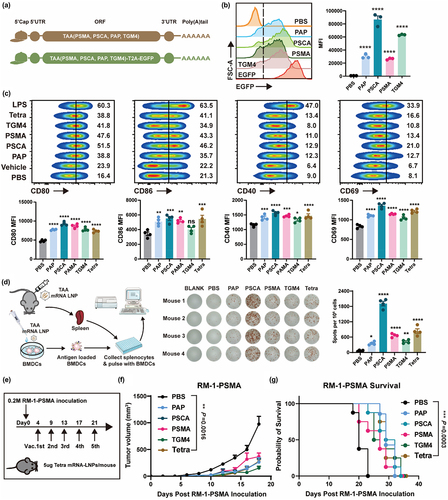
Figure 2. ImmunER enhances the function of dendritic cells and suppresses tumor growth.
(a and b) The expression of 4-1BBL (a) and OX40L (b) mRNA on the cell membranes of BMDCs. Each symbol represented BMDCs from one mouse transfected with 0.5 μg/ml mRNA-LNPs. (c) BMDCs were transfected with 0.5 μg/ml mRNA-LNPs and harvested for Western blot analysis. (d) DC2.4 migration ability after treatment with 0.5 μg/ml CCR7 mRNA-LNPs and ImmunER for 24 h was confirmed with Transwell migration assays. Results were calculated from two biological repeats in five technical duplicates. (e) In vivo BMDCs migration assay (n = 3). (f) The antigen uptake and presentation abilities of BMDCs were evaluated by flow cytometry. Each symbol represented BMDCs from a separate mouse transfected with 20 μg/ml OVA peptide. (g) Mice (n = 6–7) were grafted with 5 × 10⁵ B16-OVA tumor cells and treated with different mRNA therapeutics by intramuscular injection on days 7, 12, 18, 24, and 30. Tumor growth curve (h) and survival (i) of B16-OVA tumor-bearing mice after intramuscular injection with PBS, OVA, OVA + 4-1BBL, OVA + OX40L, OVA + CCR7, ImmunER and OVA + ImmunER mRNA therapeutics, respectively. (j) Mice (n = 11–12) were grafted with 5 × 10⁵ TC-1 tumor cells and treated with different mRNA therapeutics by intramuscular injection on days 7, 12, 18, 24, and 30. Tumor growth curve (k) and survival (l) of TC-1 tumor-bearing mice after intramuscular injection with PBS, E7, E7 + 4-1BBL, E7 + OX40L, E7 + CCR7, ImmunER and E7 + ImmunER mRNA therapeutics, respectively. Data were presented as means ± SEMs. Statistical significance was determined by One-Way ANOVA (a, b, d to f), Student t test (h, k), and Kaplan-Meier survival analysis (i, l). *P < .05, **P < .01, ***P < .001 and ****P < .0001.
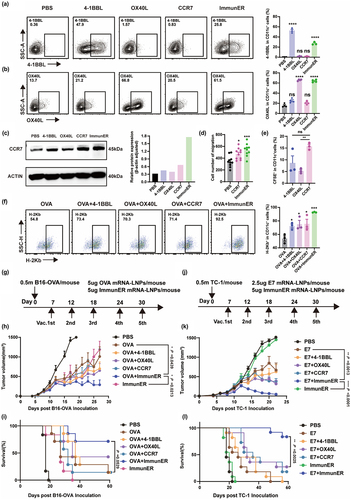
Figure 3. ImmunER enhances the level of immunity in vivo.
C57BL/6 mice (n = 4) were grafted with 5 × 10⁵ B16-OVA tumor cells and treated with PBS, luciferase, OVA, ImmunER, and OVA + ImmunER mRNA therapeutics on Day 4, 8, 12, respectively. (a) Tumor growth curve of B16-OVA tumor-bearing mice. (b) The tumors of each group were photographed 15 days after tumor inoculation. (c) SIINFEKL-H-2Kb+CD11c+MHC-II+ DCs in lymph nodes. (d) DCs maturation levels in lymph nodes. (e) OVA specific CD8+T cells in spleen. (f) OVA specific CD8+T cells in tumor. (g) IFN-γ+CD8+T cells in blood. (h) Ratios of OVA specific IgG2a/IgG1. C57BL/6 mice (n = 5) were treated with PBS, OVA, ImmunER, and OVA + ImmunER mRNA therapeutics on day 0 and 5. Blood samples were collected 3 weeks after the last treatment. (i and j) Proportion of CD8+ TCM and TEM in blood. Data in a, c to j were presented as means ± SEMs. Statistical significance was determined by One-Way ANOVA (c to j). *P < .05, and **p < .01.
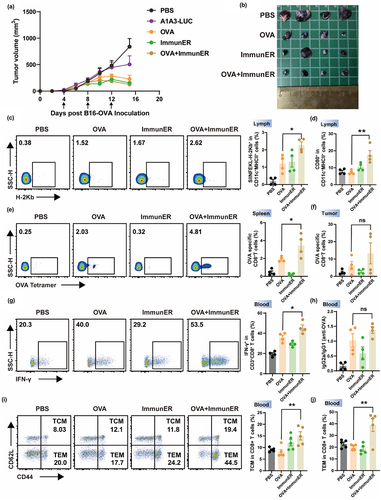
Figure 4. Tetra combined with ImmunER enhances the function of BMDCs in vitro.
(a) Representative flow cytometry data and statistical analysis showing BMDCs activation induced by PBS, Tetra, ImmunER, and Tetra + ImmunER. Each symbol represented BMDCs from one mouse treated with 1 μg/ml mRNA-LNPs. (b and c) Flow cytometry analysis (b) and ELISA (c) showed the expression of IL-12 in BMDCs. (d and e) Flow cytometry analysis (d) and ELISA (e) showed the expression of TNF-α in BMDCs. (f) Representative histograms and statistical analysis showing T cell proliferation in vitro. (g) Representative flow cytometry data and statistical data showing the killing activity of splenic T cells 7 days after the last treatment. Data in a to g were presented as means ± SEMs. Statistical significance was determined by One-Way ANOVA (a to g). *P < .05, **P < .01, ***P < .001, and ****P < .0001.
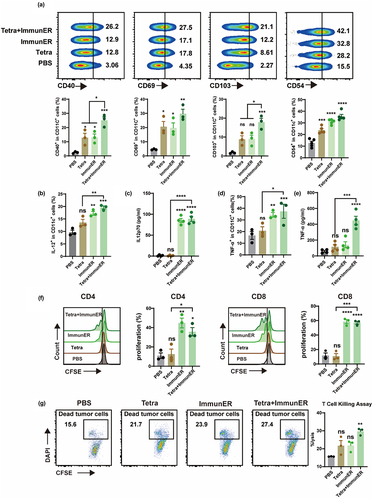
Figure 5. Tetra-ImmunER exhibits therapeutic effects and alters the tumor immune microenvironments in a PCa murine model.
(a) C57BL/6 mice (n = 8) were grafted with 2 × 10⁵ RM-1-PSMA tumor cells and treated with PBS, Tetra, ImmunER, and Tetra + ImmunER mRNA therapeutics on days 4, 9, 13, 17, and 21. Tumor size growth (b) and overall survival (c) of RM-1-PSMA-bearing mice treated with the indicated mRNA-LNPs therapeutic were shown. (d) Tumor growth curves were shown for individual animals. C57BL/6 mice (n = 5) were grafted with 2 × 10⁵ RM-1-PSMA tumor cells and treated with different mRNA therapeutics by intramuscular injection on days 4, 9, and 13. Mice were sacrificed on day 18 after tumor seeding. (e and f) Confocal fluorescence images of tumor tissues in the PBS, Tetra, ImmunER, and Tetra + ImmunER treatment groups. (e) The nuclei, CD8, and IFN-γ were stained with blue (DAPI), red, and green, respectively. (f) In consecutive sections, the nuclei, CD8, and TNF-α were stained with blue (DAPI), red, and green, respectively. (g) Total IgG, IgG1, IgG2a, and IgG2a/IgG1 levels in sera after treatment with PBS, Tetra, ImmunER, or Tetra + ImmunER. Data in b, g were presented as means ± SEMs. Statistical significance was determined by Student t test (b), Kaplan-Meier survival analysis (c) and One-Way ANOVA (g). *P < .05, **P < .01, and ****p < .0001.
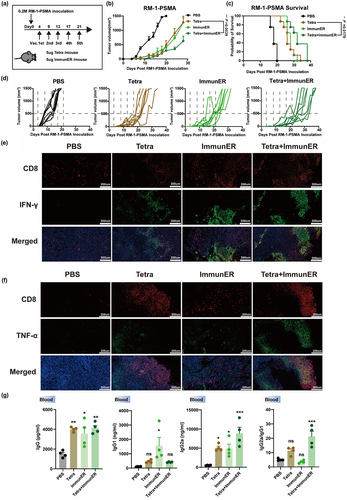
Figure 6. PCa Tetra-ImmunER upregulates cell adaptive immunity.
C57BL/6 mice (n = 5) were grafted with 2 × 10⁵ RM-1-PSMA tumor cells and treated with PBS, Tetra, and Tetra + ImmunER mRNA therapeutics on Day 4, 9, 13, respectively. Mice were sacrificed on day 18. (a and b) Representative flow dot plots and statistical analysis of CD8+ (a) and CD4+T (b) cells in tumor-infiltrating CD3+T cells. (c) Representative flow dot plots and statistical analysis of CD8+4-1BB+T cells in the tumor. (d) Representative flow dot plots and statistical analysis of CD8+OX40+T cells in the tumor. (e) Representative flow dot plots and statistical analysis of CD8+CD44+T cells in the tumor. (f and g) The percentages of Tregs (f) and TCM (g) in CD4+T cells from spleen. (h and i) The percentages of perforin-positive (h) and granzyme B-positive (i) cells in CD8+T cells from spleen. (j) The percentages of TCM in CD8+T cells from spleen. Data in a to j were presented as means ± SEM. Statistical significance was determined by One-Way ANOVA (a to j). *P < .05, **P < .01, ***P < .001, and ****p < .0001.
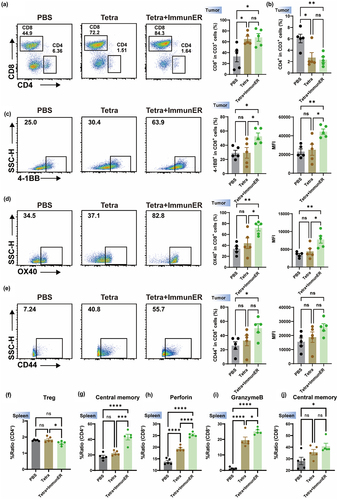
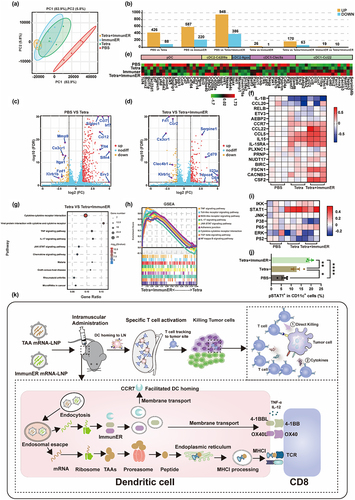
Figure 7. Sequencing of mRNA reveals the upregulation of cDC1-Ccl22 related genes and STAT1.
BMDCs (day 6, n = 4) transfected with 1 μg/ml different mRNA-LNPs for 24 h were lysed with Trizol and sent for mRNA sequencing. (a) Principal component analysis revealed that mRNA-LNPs-treated BMDCs formed separate clusters from the control mice group. (b) Statistical analysis of differentially expressed genes between the BMDC groups treated with different mRNA-LNPs. (c and d) Volcano plots showing the 514 (PBS vs. Tetra) (c) and 233 (Tetra vs. Tetra + ImmunER) (D) differentially expressed genes identified by RNA sequencing (p < .05) with a fold change greater than or equal to 2.0. (e) A heatmap showing the expression of genes associated with the DC subset. (f) The differential expression levels of 17 cDC1-CCL22-related genes were confirmed by qPCR (n = 3). (g and h) KEGG enrichment analysis (g) and GSEA (h) in the Tetra + ImmunER vs. Tetra groups. (i) The differential expression levels of pathway-related genes were confirmed by qPCR (n = 3). (j) Flow cytometry analysis showed the expression of pSTAT1 in BMDCs. (k) Diagram illustrated the strategy of intramuscular administration of Tetra and ImmunER to effectively stimulate T cells for the treatment of prostate cancer. Data in j were presented as means ± SEM. Statistical significance was determined by One-Way ANOVA (j). *P < .05, **P < .01, and ****p < .0001.
Supplemental material