
Figures & data
Figure 1. Double-negative T (DNT) cells in colorectal cancer (CRC) tissues.
(a) Representative flow cytometry plots to analyze DNT cells, defined as TCRαβ+CD56-CD4-CD8- cells. DNT cells were identified in rectal and sigmoid colon tumors, and lymph node (from left to right) of a patient. (b) Proportion of DNT cells in tumor tissues and lymph nodes in CRC patients. (c) Correlation of proportion of total T cells in tumor tissues with proportion of DNT (left) or CD8+ T cells (right) in CRC tissues analyzed by flow cytometry. (d) Representative multiplex fluorescence immunohistochemistry image in CRC tissues for the following markers: CD3, CD4, CD8, CD20, CD204, FOXP3, and cytokeratin (CK). Each cell type was defined by the combination of the marker expressions; DNT cells (blue, CD3+CD4-CD8-), CD4+ T cells (yellow, CD3+CD4+CD8-FOXP3-), CD8+ T cells (green, CD3+CD4-CD8+), Treg cells (purple, CD3+CD4+CD8-FOXP3+), B cells (red, CD20+), macrophages (pink, CD204+). (e) Correlation of total T cell density (cells/mm2) with the proportion of DNT (left) or CD8+ T cells (right) in CRC tissues detected by multiplex fluorescence immunohistochemistry.
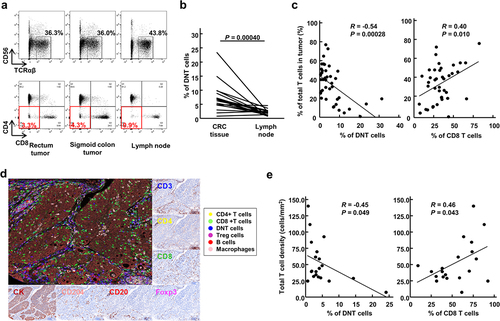
Figure 2. Comparison of TCRβ repertoire among CD4+, CD8+ and double-negative T (DNT) cells in colorectal cancer (CRC) tissues.
(a) Heatmaps of TCRβ clonotype frequency in CD4+ T, CD8+ T and DNT cells. Top 10 most abundant TCRβ clonotypes in DNT cells are shown. The gradient of red color indicates the frequency of TCRβ clonotypes, and the gray indicates TCRβ clonotypes not detected. (b) Comparison of similarity of TCRβ clonotypes between CD4+ T or CD8+ T cells and DNT cells. Jaccard indices, evaluating overlap of the TCRβ clonotypes, were calculated in a pairwise manner for individual cell types. Complete overlap resulted in Jaccard index = 1 and no overlap resulted in Jaccard index = 0.
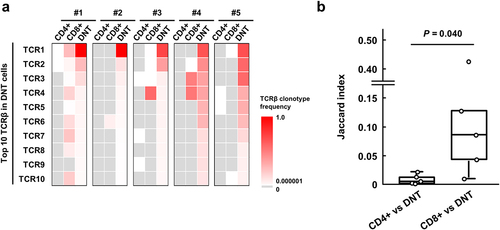
Figure 3. Single-cell transcriptome analysis of CD8+ T and double-negative T (DNT) cells in colorectal cancer (CRC) tissues.
(a) UMAP plot of a total of 12,664 cells in 4 CRC tissues. (b) Feature plots (left) and violin plots (right) showing the distribution of expression levels of T cell subset genes; CD3E, CD4, CD8A mRNAs and CD8α protein (clone RPA-T8). (c) Dot plot of expression levels of T cell subset genes to define DNT cells.
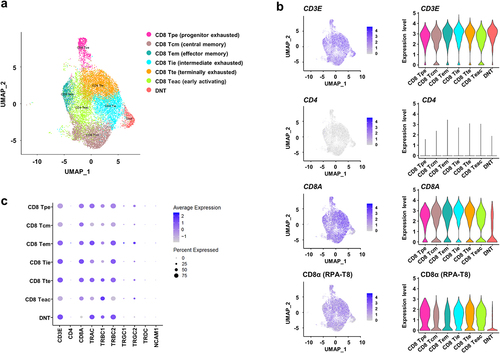
Figure 4. Transcriptional signature of double-negative T (DNT) cells.
(a) Dot plot of expression levels of functional marker genes in each functional cluster; cytokine, naïve/memory, effector, exhaustion and proliferation markers which are characterized by expressions of genes shown in the bottom. (b) T cell cytotoxicity and exhaustion scores of DNT cells and each of CD8+ T cell clusters. The scores defined as the averaged expression of genes in each signature. (c) Heatmaps of expression levels of top 10 genes expressed in each functional cluster. (d) Volcano plot of differentially expressed genes in the “DNT” cluster compared to the other CD8+ T cell clusters. (e) Gene set enrichment analysis of genes significantly down-regulated in DNT cells.
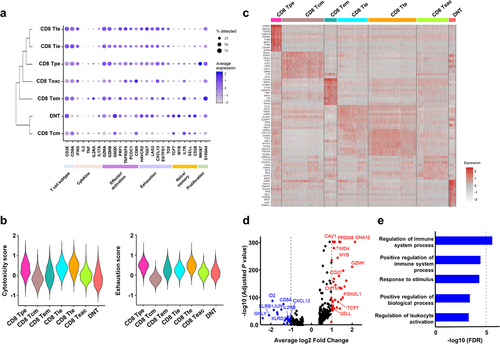
Figure 5. Flow cytometry of specific molecules and cytotoxic molecules in double-negative T (DNT) cells.
(a) Memory phenotype of DNT cells in CRC tissues (N = 5) and healthy donor’s PBMCs. (b) Proportion of GZMK+ DNT cells in CRC tissues (N = 5). (c) Proportion of perforin+ (left) or granzyme B+ (right) cells in CD8+ T and DNT cells in CRC tissues (N = 5). (d) Proportion of Fas+ (left) or FasL+ (right) cells in CD8+ T and DNT cells in CRC tissues (N = 5).
Supplemental material
Okamura_DNT_suppleTable1_20240527.pdf
Download PDF (176.1 KB)Okamura DNT_suppleFig.docx
Download MS Word (411.1 KB)Data availability statement
All data generated in this manuscript will be provided upon reasonable request to corresponding authors.