
Figures & data
Figure 1. F. prausnitzii level predicts clinical response to PD-L1 in patients with advanced non-small-cell lung cancer.
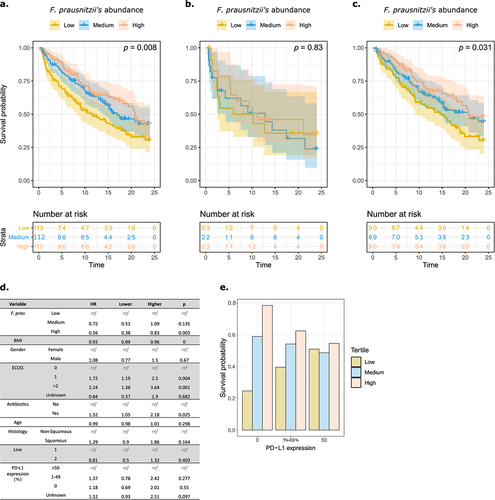
Figure 2. F. prausnitzii level predicts clinical response to ICI in a dominant group of patients with advanced melanoma.
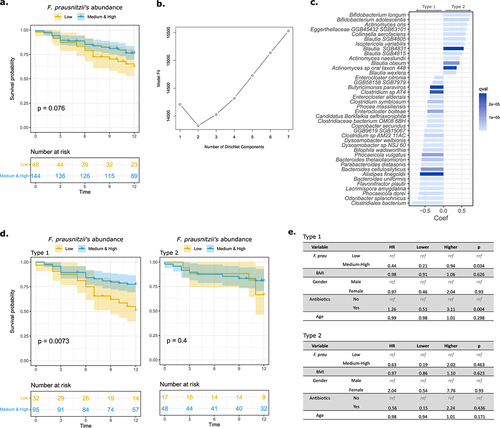
Figure 3. F. prausnitzii EXL01strain restores anti-tumor response to ICI in presence of ABX-induced gut microbiota perturbation.
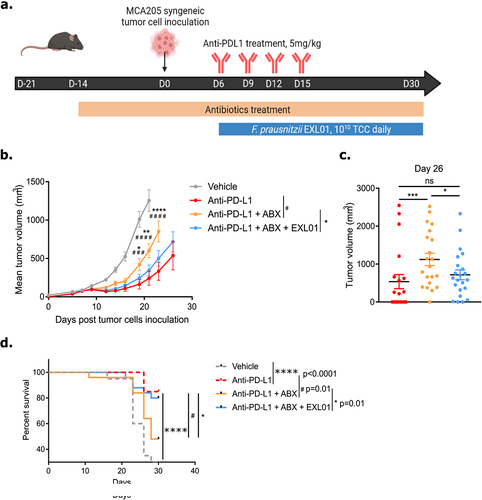
Figure 4. F. prausnitzii EXL01 strain administration does not impact fecal microbiota composition and diversity.
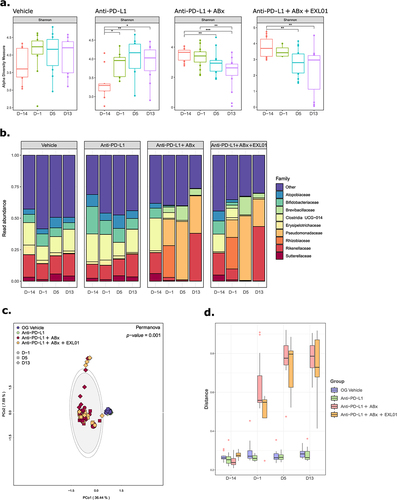
Figure 5. F. prausnitzii EXL01strain administration restores normal response to ICI at the tumor transcriptomics level in gut microbiota perturbation context.
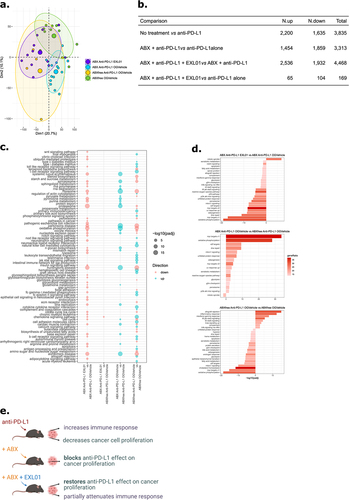
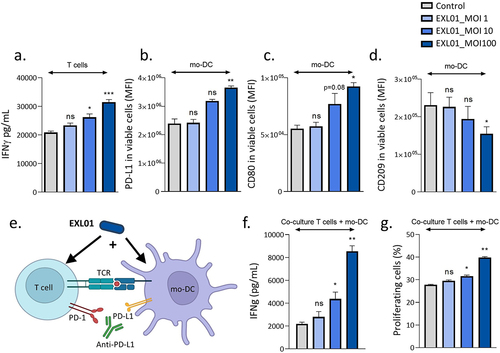
Figure 6. F. prausnitzii EXL01 boost activation of dendritic cells and T cells in the presence of anti-PD-L1.
Sup_Fig_1.jpg
Download JPEG Image (1.3 MB)
Sup_Fig_3.jpg
Download JPEG Image (3.6 MB)
Sup_Fig_4.jpg
Download JPEG Image (1.2 MB)
Sup_Fig_2.jpg
Download JPEG Image (688.9 KB)
Supplementary_material.docx
Download MS Word (18.4 KB)Data availability statement
Raw sequence RNAseq data are accessible in Gene Expression Omnibus (accession number GSE234818), and 16S data are accessible in the European Nucleotide Archive (accession number PRJNA975093).