
Figures & data
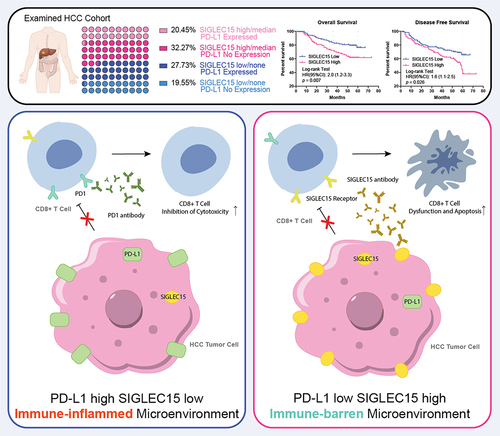
Figure 1. SIGLEC15 was highly expressed in HCC tumor samples and was related to deleterious survival of patients.
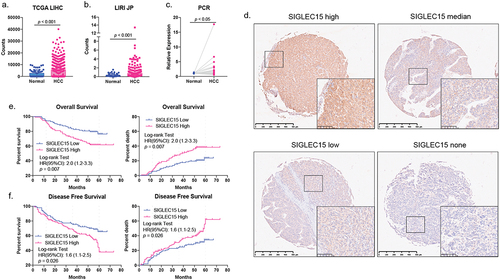
Figure 2. SIGLEC15 expression was negatively correlated with PD-L1 expression in HCC samples, relating to a barren immune microenvironment in tumor.
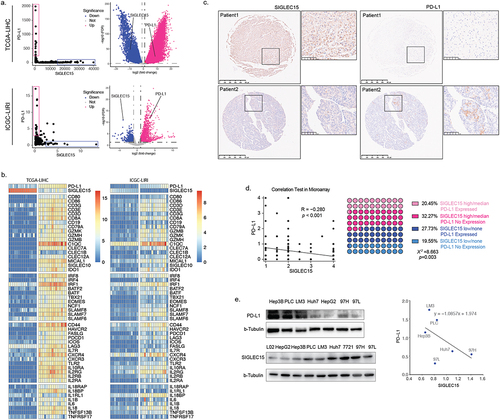
Figure 3. SIGLEC15, expressed by tumor cells, mainly promoted HCC growth through immune evasion.
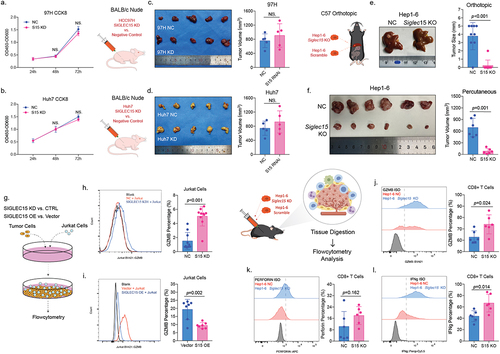
Figure 4. Anti-SIGLEC15 immunotherapy could reduce tumor burden and promote CD8+ T cell cytotoxic functions in mouse models.
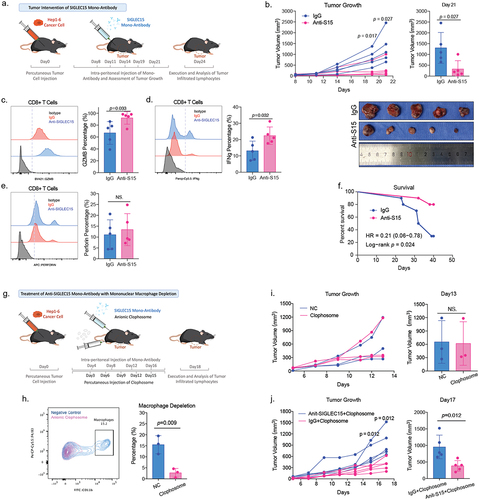
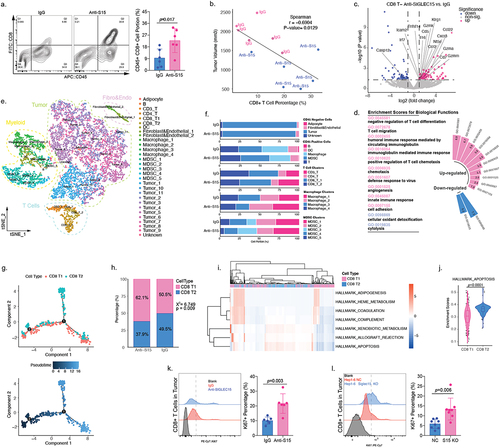
Figure 5. SIGLEC15 could induce CD8+ T cell apoptosis in HCC tumor microenvironment.
Supplemental Tables.xlsx
Download MS Excel (24.7 KB)Suppl Figure1.png
Download PNG Image (379.1 KB)
Data availability statement
Sequencing data for the manuscript were deposited in the Gene Expression Omnibus database under the accession number of GSE218411. Public datasets of LIHC and LIRI projects were downloaded from TCGA and ICGC databases respectively. There was no original code generated in the manuscript.