
Figures & data
Figure 1. MPM cells orient myeloid cells toward an immunosuppressive phenotype. Myeloid cells were cultured alone or with MPM cells for 96 h. They were then analyzed by flow cytometry for the expression of 13 markers. (a) Experimental design. (b) Proportion of myeloid cells (HLADR+CD45+) in cocultures with MPM cells (n = 5 donors for monocytes and DC, n = 6 donors for M1 and M2, 2 MPM cell lines). (c) FlowSOM clustering was performed on live cells (n = 5 donors for monocytes and DC, n = 6 donors for M1 and M2, 2 MPM cell lines). Metaclusters are shown on a UMAP dimensional reduction. (d) FlowSOM clustering was performed on HLA-DR+CD45+cells. Metaclusters are shown on the Opt-SNE dimensional reduction. The number of cells for each metacluster is shown in brackets. (e) The abundance of each culture type in metaclusters was assessed. Groups of metaclusters were annotated with wide shapes. (f) The median of fluorescence intensity (MFI) of each marker on the different metaclusters is normalized by column. (g) Principal component analysis was performed on the previously annotated metaclusters. DC, dendritic cell; GM-CSF, Granulocyte-Macrophage Colony Stimulating Factor; IL4, interleukin 4; M1, M1-like macrophage; M2, M2-like macrophage; MC, metacluster; M-CSF, Macrophage Colony-Stimulating Factor; MPM, Malignant Pleural Mesothelioma.
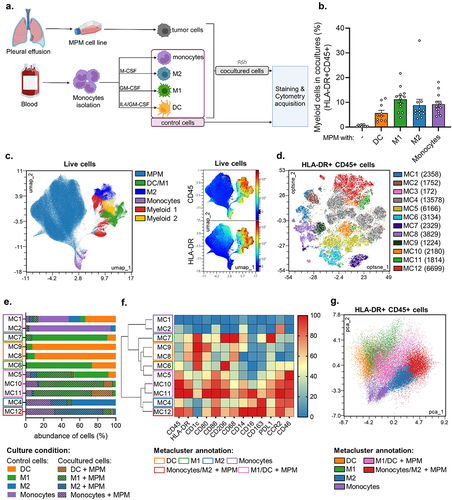
Figure 2. Myeloid cells reduce GFP expression from MV-GFP in MPM cells without IFN-I genes. Two MPM cell lines, Meso13 or Meso34, were cultured either alone or with myeloid cells. IFN-I genes are deleted in Meso13. Meso34 has probably a defect in ISG production. Cells were infected with MV-GFP at MOI = 1. (a, b) After 72 h, cells were stained as in Figure 1. (b) MV-GFP relative MFI (RMFI) corresponds to the MFI ratio of MV-GFP infected over uninfected MPM cells (HLA-DR or CD45 negative cells). Data are presented as percentage of the RMFI of MPM cells in monocultures (n = 6 donors, Kruskal-Wallis test). (c-d) Cocultures were treated or not with ruxolitinib, an inhibitor of IFNAR signaling, and MV-GFP fluorescence was measured for 10 days (n = 4 donors, Kruskal-Wallis test). (e) Cultures were treated with ruxolitinib or IFN-I. Nuclei were labeled with Hoechst (blue), myeloid cells were stained with anti-CD45 antibody (red) and GFP from MV-GFP replication appears in green. Fluorescence was observed by confocal microscopy (representative images of 6 donors, scale bar = 200 µm). DC, dendritic cell; IFN, Interferon; ISG, Interferon stimulated genes; M1, M1-like macrophage; M2, M2-like macrophage; MOI, multiplicity of infection; Monos, Monocytes; MPM, Malignant Pleural Mesothelioma; MV, Infected with MV; NI, Uninfected. ns, non-significant, * p < 0.05, ** p < 0.001, *** p < 0.001.
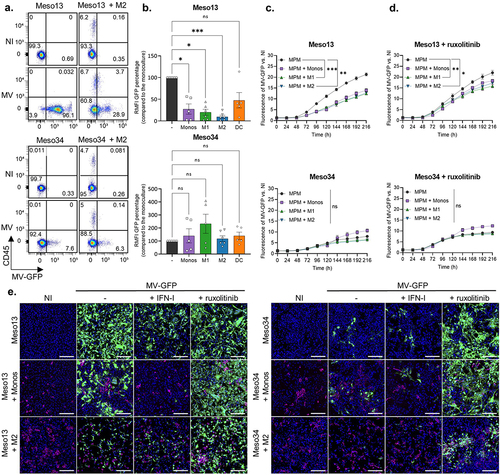
Figure 3. MV induces the expression of antiviral pro-inflammatory pathways in myeloid cells. Meso13 and Meso34 were cultured with monocytes or M2. After 24 h, MPM cells were infected or not with MV at MOI = 1. After 72 h of infection, cells in cocultures were sorted according to CD45 expression. (a-c) a 3’RNA sequencing was performed on each cell type (n = 3 to 7 samples per condition). Gene expression volcano plot (a) the 25 most deregulated pathways (b) or the 100 most deregulated genes in M2 and the 100 most deregulated genes in monocytes (c) upon infection in myeloid (CD45+) cells cocultured with MPM cells are shown. The heatmap is normalized by line. (d) Expression of key markers in myeloid cells was assessed by qPCR (n = 4 to 6 donors, Mann-Whitney test, *p < 0.05, **p < 0.001). M2, M2-like macrophage; MOI, multiplicity of infection; Monos, Monocytes; MPM, Malignant Pleural Mesothelioma; MV, Infected with MV; NI, Uninfected.
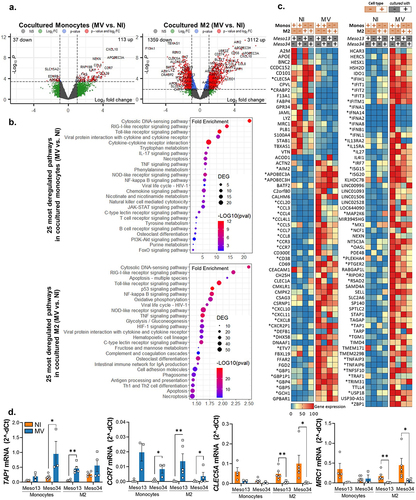
Figure 4. Upon infection, myeloid cells induce the expression of ISG in MPM cells. Meso13 and Meso34 were cultured with monocytes or M2. After 24 h, MPM cells were infected or not with MV at MOI = 1. After 72 h of infection, tumor cells in cocultures were negatively sorted according to CD45 expression. (a-c) a 3’RNA sequencing was performed on each cell type (n = 6 to 8 samples per condition). Gene expression volcano plot (a), the 25 most deregulated pathways (b), or the 100 most deregulated genes (c) upon infection in MPM cells cocultured with myeloid (CD45+) cells are shown. The heatmap is normalized by line. (d) Expression of three ISG, strictly dependent of IFN-I, were assessed in tumor cells cultured alone or with myeloid cells by qPCR (n = 4 to 6 donors, Kruskal-Wallis test, *p < 0.05, ***p < 0.001). IFN, interferon; ISG, Interferon stimulated genes; M2-like macrophage; MOI, multiplicity of infection; Monos, Monocytes; MPM, Malignant Pleural Mesothelioma; MV, Infected with MV; NI, Uninfected.
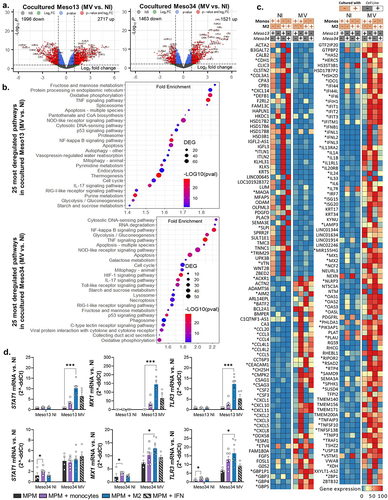
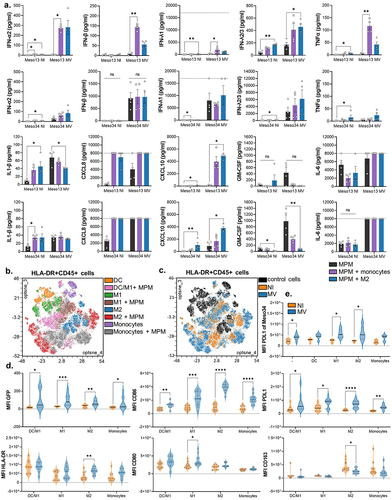
Figure 5. MV oncolytic action induces pro-inflammatory proteins expression in myeloid cells. (a) MPM cells were cultured alone or with myeloid cells for 96 h. Some of the cocultures were infected with MV at MOI = 1. After 72 h, cytokines secretion was measured in culture supernatants by Biolegend “human anti-virus response” cytokine array (n = 4 donors, Kruskal-Wallis test). Dotted line represents the upper detection limit. (b-e) Myeloid cells were cultured alone or with MPM cells. Some of the cocultures were infected at 24 h with MV-GFP. They were analyzed at 96 h by flow cytometry for the expression of 13 markers. After gating of HLA-DR+CD45+ cells, FlowSOM clustering was performed on cells control and cells cocultured with infected or uninfected MPM cells (n = 5 donors for monocytes and DC, n = 6 donors for M1 and M2, 2 MPM cell lines). (b) Annotations of metaclusters are shown on an Opt-SNE dimensional reduction. (c) Culture conditions (HLA-DR+CD45+ cells: control, cultured with non-infected MPM cells, cultured with MV MPM cells) are shown on an Opt-SNE dimensional reduction. (d) Expression of immune-related molecules on HLA-DR+CD45+cells, annotated in B, cocultured with infected (blue) or uninfected (orange) MPM cells (Mann-Whitney test). (e) Expression of PDL1 on Meso34 infected or not, cocultured with myeloid cells (Mann-Whitney test). DC, dendritic cell; M1, M1-like macrophage; M2, M2-like macrophage; MFI, median of fluorescence; MOI, multiplicity of infection; MPM, Malignant Pleural Mesothelioma; MV, Infected with MV; NI, Uninfected. ns, non-significant, *p < 0.05, **p < 0.001, ***p < 0.001.
TableS4.xlsx
Download MS Excel (25.4 KB)TableS2.xlsx
Download MS Excel (11.1 KB)TableS3.xlsx
Download MS Excel (12.7 KB)TableS5.xlsx
Download MS Excel (25.2 KB)TableS6.xlsx
Download MS Excel (23.5 KB)FiguresSup.pdf
Download PDF (4.3 MB)TableS1.xlsx
Download MS Excel (10.1 KB)Data availability statement
The transcriptomic data that support the findings of this study are available online on the GEO Omnibus site (GSE247526). Other raw data and materials can be made available upon reasonable request to the corresponding author.