
Figures & data
Figure 1. Vaccine rollout and mandated measures in France.
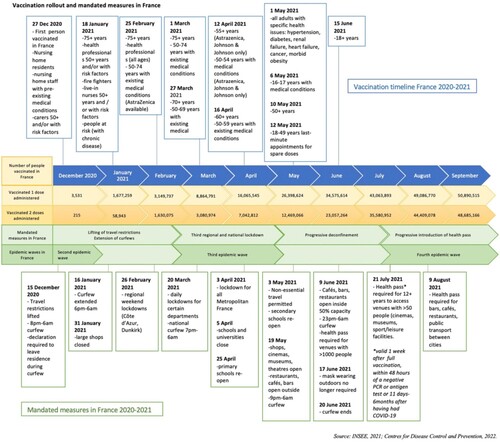
Figure 2. Distribution of protective behaviours according to initial coding.
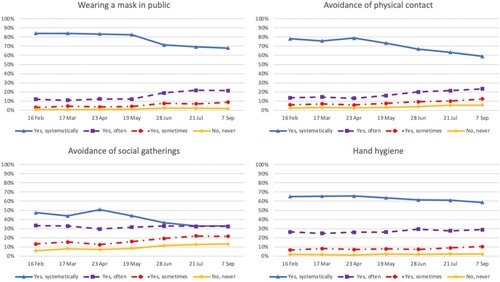
Table 1. Behaviour survey questions and responses.
Figure 3. Vaccination status during the vaccine rollout in France, February – September, 2021.
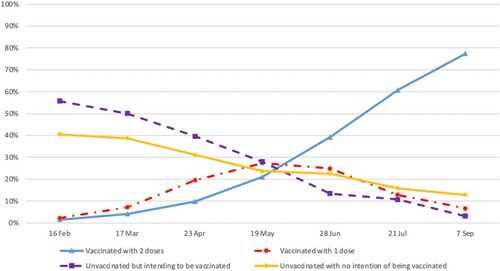
Figure 4. Engagement in protective behaviours according to vaccination status.
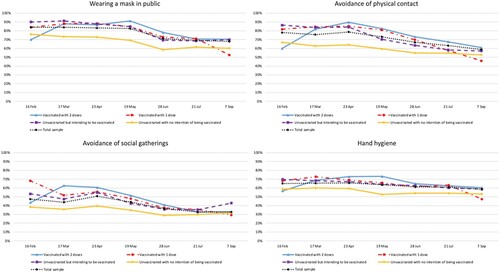
Table 2. Participant vaccination status according to age, risk factors (chronic illness), socio-demographic characteristics and survey wave (February – September, 2021).
Table 3. Odds ratios of protective behaviour according to vaccination status.