
Figures & data
Figure 1. CONSORT (2012) Flow Diagram.
A CONSORT flow-chart showing the study flow including randomisation to the intervention and control conditions.
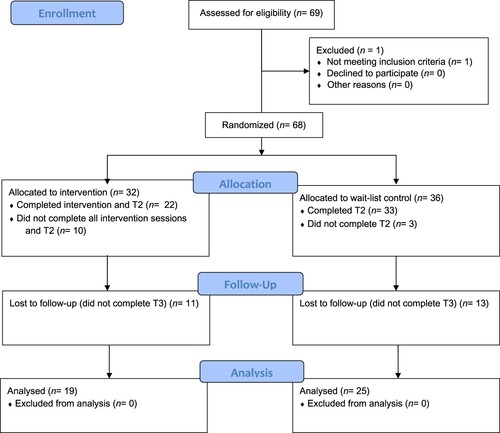
Table 1. Participant characteristics.
Table 2. Information about visible differences of participants.
Table 3. Outcome measure means for each group at each time point.
Table 4. Acceptability data: Intervention Feedback.
Table 5. Content analysis of writing task data (Intervention group only).
Table 6. Descriptions and examples of content analysis categories from participants’ writing entries.
Data availability statement
Anonymous data can be made available on request.