Figures & data
Figure 1. PRVABC59 can infect systemic and privileged organs in immunocompetent mice. (A) Body weight changes were monitored for 120 DPI. (N = 10). PRVABC59 infected mice were immunocompetent, while mice denoted as αIFNAR (anti-IFNAR) received a single administration of monoclonal antibody that functionally blocks IFNAR signaling 24 hours prior to infection. The N for αIFNAR mice decreased from 10 to 5 between 3 and 6 DPI, and further decreased from 5 to 1 between 10 and 30 DPI. These loses are denoted by vertical lines. The horizontal dotted line represents lethal weight loss endpoint. (B) Survival of mice infected with ZIKV with and without prior administration of αIFNAR mAB. (C-D) Active viral replication was determined by infectious co-culture (C) at 0, 10, and 100 DPI. Total ZIKV genomic RNA was quantified by qRT-PCR (D; N = 5) at 0, 10, and 100 DPI. For panels C and D, N = 3 at 0 and 3 DPI, and for PRVABC59 group at 100 DPI. N = 1 for αIFNAR at 100 DPI. All error bars in all panels reflect Standard Deviation. Data was analyzed by Two-way ANOVA using Sidak post-hoc correction. For all panels, * is p < .05, ** is p < .01, *** is p < .001, and **** is p < .0001.
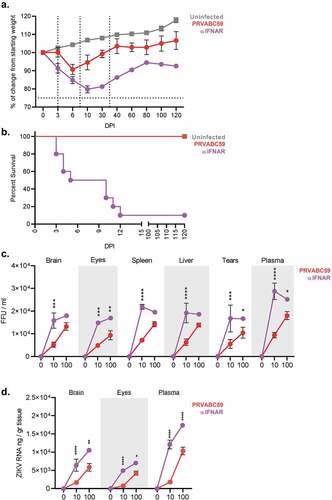
Figure 2. Competent mice infected with ZIKV-PRVABC59 demonstrate distinct ocular and motor/neural symptomatology that correlate with viral load. Ocular clinical scores were determined via palpebral (A) and visual placement (B) reflexes. (Two-way ANOVA with Bonferroni’s post-hoc correction; N = 10). Motor/neural clinical scores were evaluated by rear-limb withdrawal reflex tests (C) and by grip time tests (D). The dotted line among grip time tests indicates the standard time a healthy animal should endure test conditions. (Two-way ANOVA with Bonferroni’s post-hoc correction; N = 10). (E) Symptom severity and viral load at 100 DPI in the affected tissue were analyzed by Pearson’s test to determine potential correlations for palpebral (i), visual placement (ii), and rear limb withdrawal reflexes (iii) and for grip time tests (iv). Dashed lines represent 95% confidence interval bands; Pearson’s correlation coefficient and p-values are listed for each graph. All correlation analyses used infectious and symptom data (N = 25). For all panels, * is p < .05, ** is p < .01, *** is p < .001, and **** is p < .0001. All error bars in all panels reflect standard deviation.
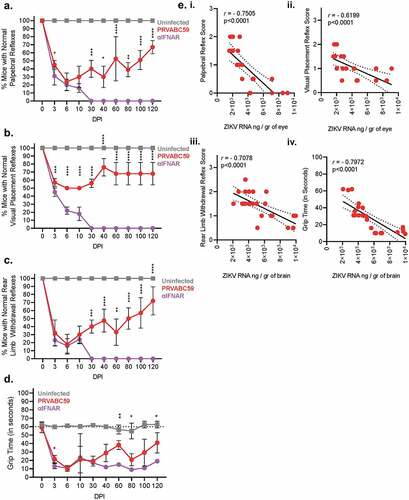
Figure 3. PRVABC59-induced antibodies are weakly neutralizing and enhance non-homologous infection. Antibody kinetics for IgG total (A), IgG1 (B), and IgG2a (C) that are specific to PRVABC59 were determined up to 120 DPI via ELISA using whole, inactivated virus particles. (N = 5). (D-E) Antibody neutralization was evaluated by determining the endpoint antibody titer necessary to neutralize 50% of live virus (IC50) among homologous and non-homologous ZIKV strains (D; N = 5) and a representative strain from all four DENV serotypes (E; N = 5). The horizontal line indicates when 50% of live virus has been neutralized. (F-G) Antibody-mediated infection was evaluated among homologous and non-homologous ZIKV strains (F) and a representative strain from all four DENV serotypes (G; N = 5). Background fluorescence, denoted by the horizontal dotted line, was determined by combining virus, no antibody sample, and cells. All error bars in all panels reflect standard deviation.
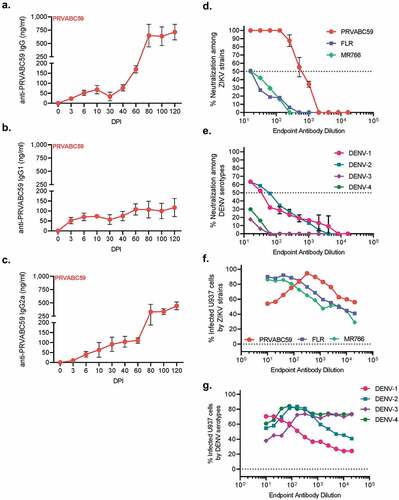
Figure 4. Tenacious corneal and retinal hyperplasia coincides with persistent ocular infection, increasing levels of cell death, and chronic inflammation. (A) Macroscopic (top) and fundus (bottom) imaging was done at 0, 3, 10, 30, and 100 DPI to visualize ocular pathology. (B-C) Eyes from infected and uninfected mice were harvested 10 (B) and 100 (C) DPI for H&E and immunofluorescent staining. H&E images of corneal and retinal layers were taken at 20x to assess pathology. (D-E) ZIKV infectivity was determined by immunofluorescent staining for flavivirus antigens (Two-way ANOVA with Bonferroni’s post-hoc; N = 10). (F-G) Similarly, TUNEL staining for cell death was performed at 10 and 100 DPI (Two-way ANOVA with Bonferroni’s post-hoc; N = 10). (G) qRT-PCR on pro-inflammatory proteins, pain mediators, MMPs, and anti-inflammatory proteins among infected brains were normalized to GAPDH and then to expression levels of uninfected controls using the ΔΔCt method (N = 5). For all panels, * is p < .05, ** is p < .01, *** is p < .001, and **** is p < .0001. All error bars in all panels reflect standard deviation.
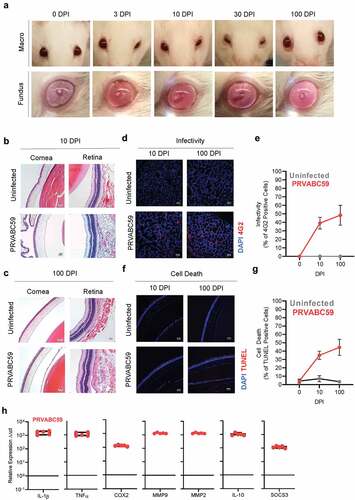
Figure 5. PRVABC59 infection in the hippocampus and cortex corresponds to decreased levels of myelin and persistent inflammation. (A) Brains were sectioned and stained for ZIKV antigen 100 DPI. Foci were counted in hippocampal (HC) and cortical regions (N = 15). (B-C) MBP expression was determined by immunofluorescent staining in mid-brain cortex regions of mice (B), expression was normalized to background using the CTCF calculation and is presented as normalized MFI (C; student’s t-test; N = 10). (D-F) mPLP expression among mid-brain sections was normalized to background using the CTCF calculation and is presented as normalized MFI in both hippocampus and cortex regions (Two-way ANOVA with Bonferroni’s post-hoc analysis; N = 10). (G-I) Vim expression was similarly quantified among hippocampus and cortex regions from infected mice. (Two-way ANOVA with Bonferroni’s post-hoc analysis; N = 10). (J) qRT-PCR on pro-inflammatory proteins, pain mediators, MMPs, and anti-inflammatory proteins among infected brains were normalized to GAPDH and then to expression levels of uninfected controls using the ΔΔCt method (N = 5). For all panels, * is p < .05, ** is p < .01, *** is p < .001, and **** is p < .0001. All error bars in all panels reflect standard deviation.
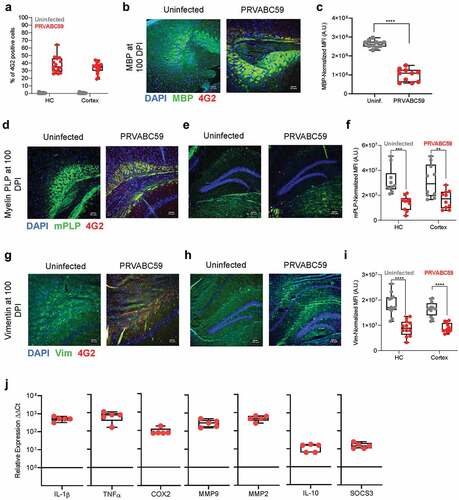
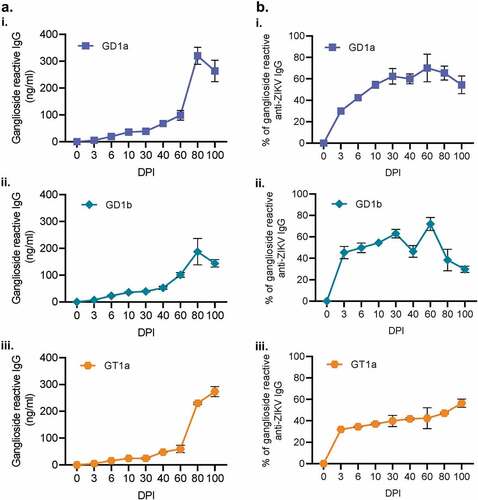
Figure 6. IgG produced during ZIKV infection are cross-reactive to host gangliosides. Antibodies generated during ZIKV infection were also evaluated for their reactivity to GD1a, GD1a, and GT1a gangliosides (Ai, ii, and iii, respectively) via ELISA. The proportion of ganglioside-reactive antibodies to ZIKV-specific IgG was then determined for 0, 3, 10, 60, 80, and 100 DPI. (N = 5). All error bars in all panels reflect standard deviation.