
Figures & data
Figure 1. Study design.
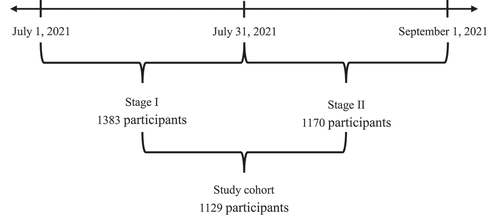
Table 1. Participants’ baseline characteristics (N = 1129).
Figure 2. (a) the four-group health beliefs trajectory (group 1: Very low-stable; group 2: Low-stable; group 3: Medium-stable; group 4: High-stable). (b) the two-group perceived susceptibility trajectory (group 1: Low-stable; group 2: High-stable). (c) the three-group perceived severity trajectory (group 1: Low-stable; group 2: Medium-stable; group 3: High-stable). (d) the two-group perceived benefits trajectory (group 1: Low-stable; group 2: High-stable). (e) the three-group perceived barriers trajectory (group 1: Low-stable; group 2: Medium-stable; group 3: High-stable). (f) the three-group cues to action trajectory (group 1: Low-stable; group 2: Medium-stable; group 3: High-stable).
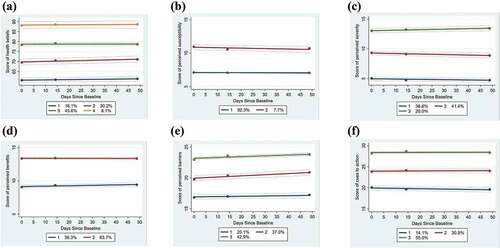
Figure 3. (a) the three-group physical component summary trajectory (group 1: Low-declining; group 2: Medium-stable; group 3: High-slow increasing-stable). (b) the three-group mental component summary trajectory (group 1: Low-declining; group 2: Medium-stable; group 3: High-stable).
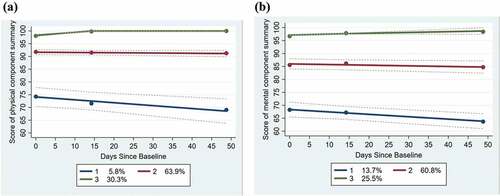
Table 2. Summary of group-based trajectory analysis.
Table 3. Multinomial logistic regression to assess predictors associated with global health beliefs trajectory.
Table 4. Multinomial logistic regression to assess predictors associated with perceived susceptibility and perceived severity trajectory.
Table 5. Multinomial logistic regression to assess predictors associated with perceived benefits, perceived barriers and cues to action trajectory.