Figures & data
Figure 1. Publication trend of mRNA vaccine patents. (a) the number of mRNA vaccine patents invented by publication year since 1962. (b) mRNA vaccine patent families by publication year in the top five region of patent assignees. (c) mRNA vaccine patent documents by publication year in the top seven jurisdiction’s patent offices where patents were filed. The cumulative numbers involving regions and patent offices are shown in Supplementary Figures 2 and 3, respectively. (d) the time interval between the patent publication time and the application time (country/region code and name are shown in Supplementary Table S1).
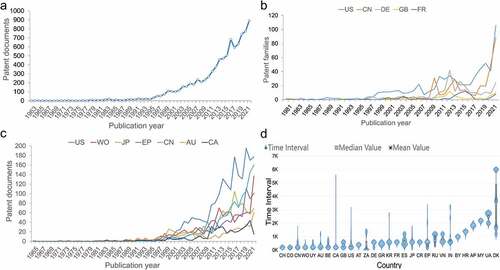
Figure 2. Collaboration networks of mRNA vaccine patents. (a) Network of cooperative relationships between institutions. The nodes represent the assignee, and the edges represent the cooperative relationship between the co–assignees. The institutional collaboration network does not include the individual assignee and labels names of top active institutions. (b) Regional collaboration network. Colored nodes denote regions in which assignees were located, including individual patent assignees, while edges correspond with collaborations based on co–assignee relations. Node size is scaled to the number of patent families (also given as a numerical value of the degree), while the thickness of edges represents collaboration frequency (also given as a numerical value of the weighted degree).
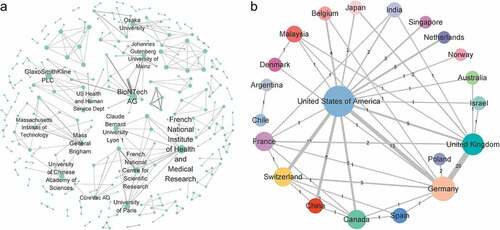
Table 1. Ranking of top 20 patent assignees.
Figure 3. Technological categories of mRNA vaccine patents. (a) the top 20 international patent classification (IPC) code since the 1980 annual active figure (detailed information about the IPC code are available at Supplementary table S2). (b) a landscape by ThemeScape using information included in title abstract and claims of the mRNA vaccine patents. The red dots represent the most recent patents issued between 2017 and 2021.
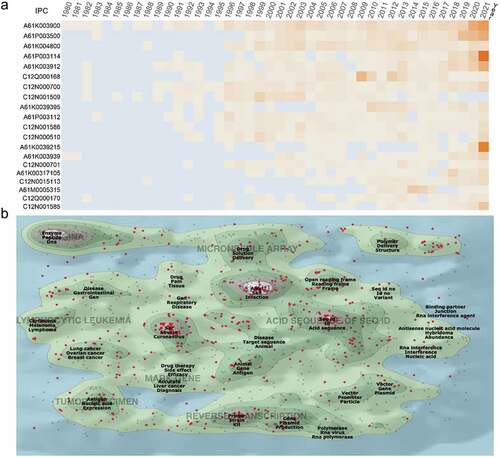
Figure 4. Patent citation network of mRNA vaccines. (a) Global Citation network. Nodes represent patents and edges represent reference relationships. The node size is based on the connection out–degree (i.E., times of citation). (b) Time slice chart of the citation network. The patent was divided into 12 time slices according to the time when it was published, with one slice for 2010 and its predecessor, and one slice for each year from 2011 to 2021.
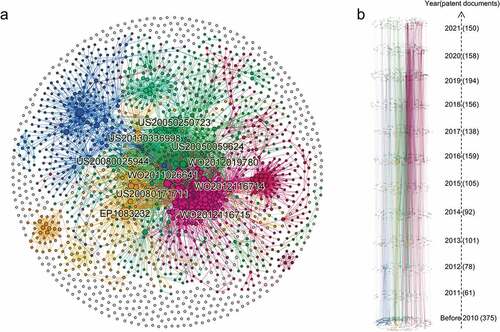
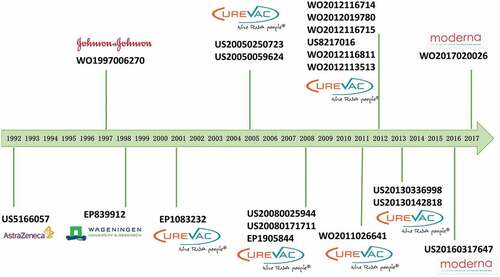
Figure 5. Milestone of mRNA patents. The technological temporal route derived from the global patent citation network based on the top 10 citation out–degree.