Figures & data

Figure 1. The HD-MAP used in the study. (a) integrated applicator, (b) opened device with 1 cm2 MAP (scale bar = 1 cm).
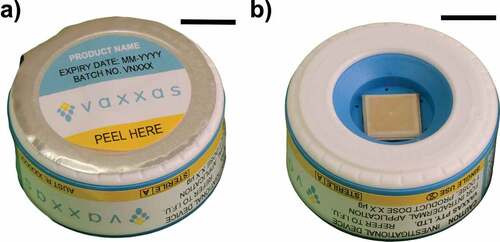
Figure 2. Representative images of self-administered HD-MAP applications to the (a) deltoid upper arm, (b) volar foreman and (c) the posterior shoulder (scale bar = 4 cm).
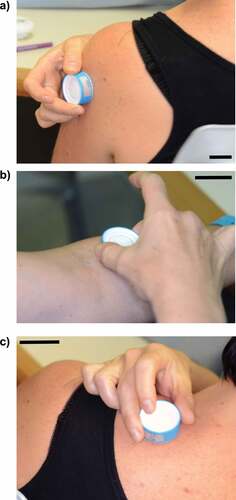
Figure 3. Representative images of skin reactions over time at HD-MAP forearm application sites. Photographs of treatment sites applied by a trained user (ai) erythema evident 10 min post-application, (aii) 7 d and (aiii) site resolved by 28 days, and self-administered application sites (bi) 10 min post-application, (bii) 7 d and (biii) 28 d (scale bar = 1 cm). Dermatoscopy images (ci) pre-application, (cii) 10 min post-application and (ciii) 28 d after application of HD-MAP by trained user and self-administered application (di) pre-application, (dii) 10 min post-application (diii) 28 d post-application (scale bar = 1 mm increments).
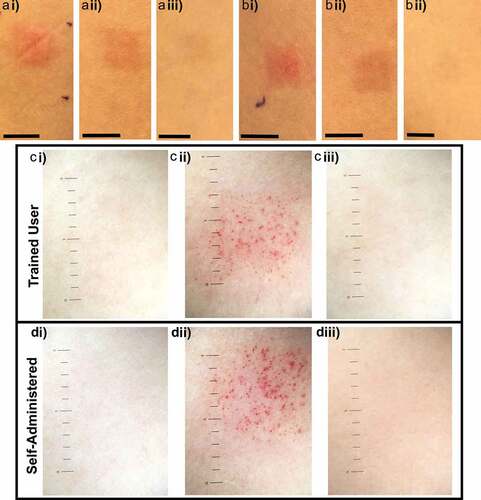
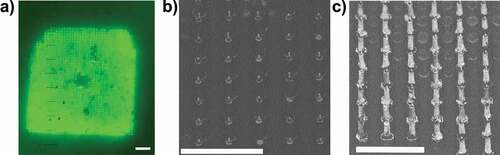
Figure 4. Surface engagement of HD-MAPs. (a) Fluorescent dermatoscope image detecting fluorescein on skin after HD-MAP application, scale bar = 1 mm. (b) SEM image of coated microprojections pre-application mounted with 45°C angle, the coating covers the microprojection construction material (scale bar = 500 um). (c) SEM image from a HD-MAP after application to human skin mounted with 45°C angle, the microprojections are no longer coated and are now visible (scale bar = 500 um).