Figures & data
Figure 1. Recovery of fertile modified tomato plants expressing the bacterial katE gene. (a) The hypocotyl. (b and c) The callus induction. (d and e) The shoot induction. (f) The modified plants transferred to soil
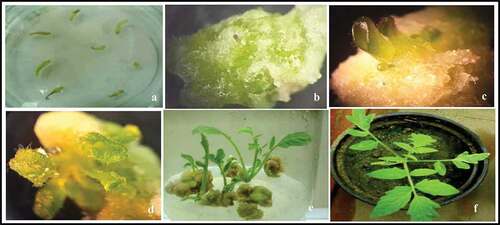
Table 1. Transformation frequencies of tomato hypocotyl after Agrobacterium-mediated transformation using the pBI121-katE vector
Figure 2. Detection of katE gene by PCR in the T0 of putative modified plantlets. M: DNA Ladder (100 bp DNA Ladder RTU GeneDirex & TriDye™ 100 bp DNA Ladder BioLabs), Nc: negative control (wild type or non-modified plantlets), Pc: positive control (pBI121-katE vector). (a) katE gene detection in Castle Rock cultivar; lanes 1 and 4–7: modified plantlets; lanes 2 and 3: non-modified plantlets. (b) katE gene detection in Super Strain B cultivar; lanes 1, 3–6, and 8: modified plantlets; lanes 2 and 7: non-modified plantlets
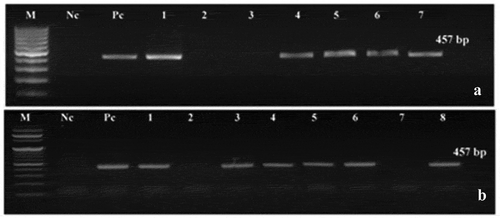
Figure 3. Dot blot analysis with katE gene-specific probe for confirming the inheritance of the katE gene into T2 tomato lines. Nc-C: negative control (non-modified plant) of Castle Rock cultivar, Nc-S: negative control (non-modified plant) of Super Strain B cultivar, Pc: positive control (pBI121-KatE vector), C1, C2, and C4-C7: modified lines of Castle Rock cultivar, C3: non-modified line of Castle Rock cultivar, S1, S3-S6, and S8: modified lines of Super Strain B cultivar, S2 and S7: non-modified lines of Super Strain B cultivar
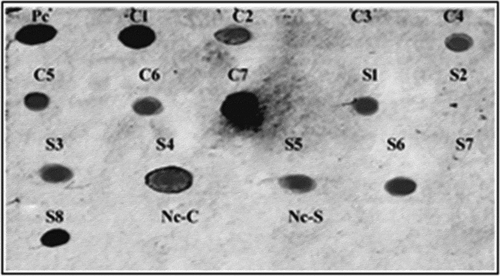
Figure 4. Plant growth of non-modified (wild-type) and katE overexpression (modified) plants under artificial infestation with Fusarium oxysporum f. sp. lycopersici.
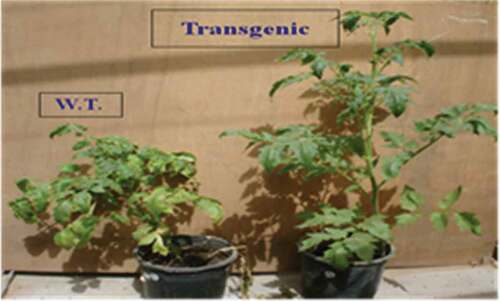
Figure 5. Effect of FOL infection on modified line leaves. (a) non-modified leaves. (b) and roots. (c) of Castle Rock cultivar
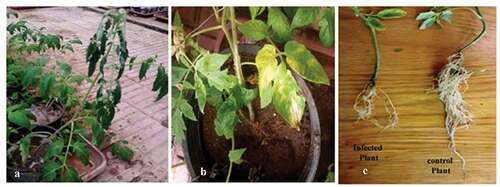
Figure 6. RT-PCR analysis of the katE gene mRNA in T2 modified tomato lines. C4, C5, and C7: modified lines no. 4–7; Nc: non-modified plant; M: 100 bp DNA ladder
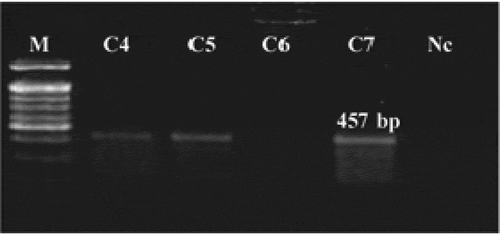
Table 2. Combined analysis of variance of a split-plot design for superoxide dismutase (SOD), catalase (CAT), and peroxidase (POD) enzymes
Figure 7. Defense enzyme activities in Castle Rock and Super Strain B cultivars. I. SOD activity, II. Catalase activity, III. Peroxidase activity, A: wild type (non-modified) plants, B: wild-type plants infected with Fusarium oxysporum f. sp. lycopersici, C: T2 modified plants, D: T2 modified plants infected with Fusarium oxysporum f. sp. lycopersici. Statistical analysis was performed using GraphPad Prism 8, using a two-way ANOVA with Dunnett’s multiple-comparison posttest; * = P < .05, ** = P < .01, *** = P < .001, ns = non-significant
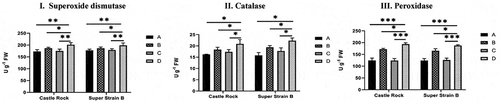
Table 3. Percentage of susceptible plants, plants showing mild symptoms, and resistant plants in modified and non-modified tomato lines after the Fusarium oxysporum f. sp. lycopersici infection
Table 4. The nucleotide sequence of the katE and nptII primers used for PCR analysis
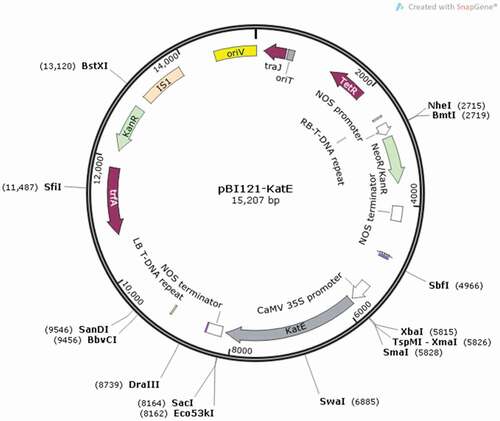
Figure 8. Schematic illustration of the pBI121-KatE constructed binary vector; Abbreviations: RB: right border; nosP: nopaline synthase (NOS) promoter; NPT-II (KanR): neomycin phosphotransferase-II gene; nosT: nopaline synthase (NOS) terminator; 35SP: cauliflower mosaic virus (CaMV) 35S promoter; katE: E. coli catalase gene; LB: left border