
Figures & data
Figure 1. Genetic relationships among the studied soybean lines and design of the grouping comparisons. (a) Genetic relationships among the studied soybean lines. (b) Experimental design of pairwise comparisons of gene expression between non-GM lines and GM lines. (C) Comparisons among non-GM parental soybean lines.
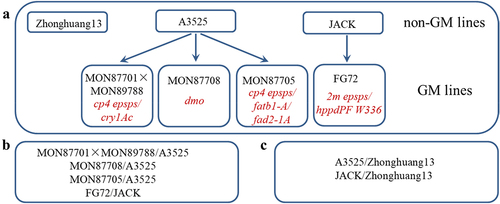
Table 1. Summary of sequence information for the 28 DEG libraries.
Figure 2. Principal component analyses (PCA) of gene-expression levels in the four tissues of seven soybean lines.
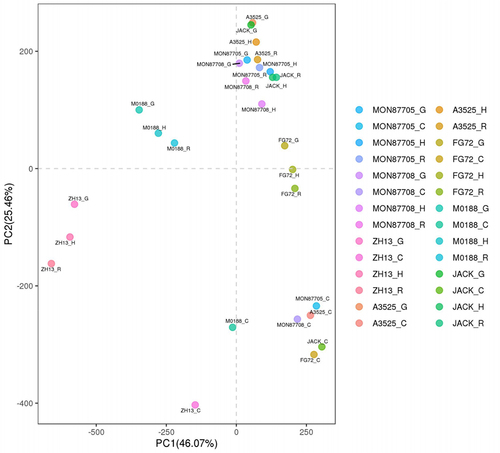
Figure 3. Differentially expressed genes for the two types of comparisons among GM and non-GM lines. (a) Numbers of DEGs for the six pairs of comparisons. For each comparison, the green bar represents the upregulated genes, and the orange bar represents the downregulated genes. C: cotyledon, G: germ, H: hypocotyl, R: radicle. (b) Venn diagram for the three non-GM line comparisons. (c) Venn diagram for the four GM lines compared with their donor parents.
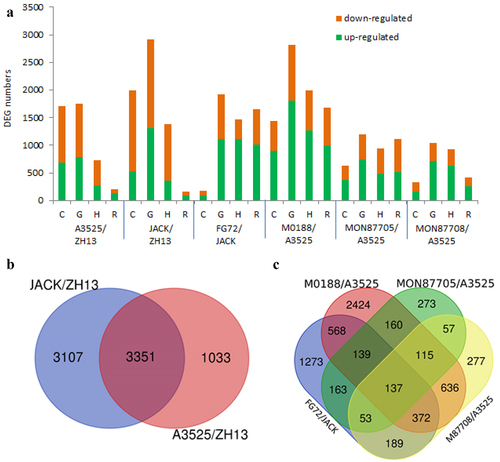
Figure 4. GO analysis results for DEGs in the two types of comparisons among GM and non-GM lines. (a) GO analysis tree for the three non-GM line comparisons. (c) GO analysis for the four GM lines compared with their donor parents.
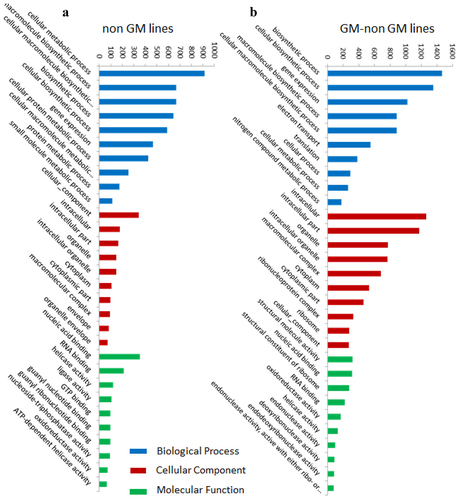
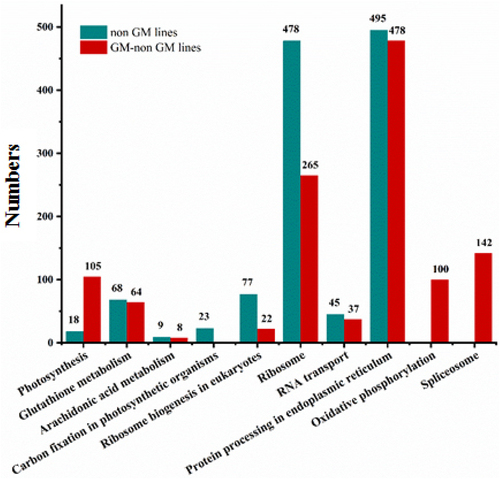
Figure 5. KEGG analysis results for DEGs in the two types of comparisons among the GM and non-GM lines. (a) KEGG pathway analysis of the three non-GM line comparisons. (c) KEGG pathway analysis of the four GM lines compared with their donor parents.
Supplemental Material
Download MS Excel (1.7 MB)Data availability statement
The sequence data was submitted to NCBI database and the number code is PRJNA668923.