4,424
Views
3
CrossRef citations to date
0
Altmetric
Articles

Two decades of smart growth in Maryland (U.S.A): impact assessment and future directions of a national leader

ORCID Icon & ORCID Icon
Pages 22-37 | Received 06 Oct 2016, Accepted 02 Mar 2017, Published online: 20 Mar 2017

Figures & data

Figure 1. Priority Funding Areas in Maryland. Data source: Maryland Department of Planning; U.S. Census (Source: Authors).
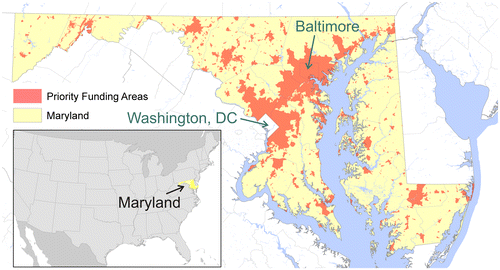
Figure 1. Priority Funding Areas in Maryland. Data source: Maryland Department of Planning; U.S. Census (Source: Authors).

Table 1. Ten principles of smart growth – Smart Growth Network.

Figure 2. MSTM study area (Source: Authors).

Figure 2. MSTM study area (Source: Authors).

Table 2. Implemented scenarios to analyze the effects of Smart Growth policies.

Figure 3. Zones with access to rail stations within a 1-mile buffer (Source: Authors).

Figure 3. Zones with access to rail stations within a 1-mile buffer (Source: Authors).

Figure 4. Lorenz curve of household distributions (left) and Gini coefficients of households and employment distributions (right) in 2030.

Figure 4. Lorenz curve of household distributions (left) and Gini coefficients of households and employment distributions (right) in 2030.

Figure 5. Average trip length in 2030.

Figure 5. Average trip length in 2030.

Figure 6. Share of transit trips in 2030.

Figure 6. Share of transit trips in 2030.

Figure 7. Vehicle-Miles Traveled (VMT) in 2030.

Figure 7. Vehicle-Miles Traveled (VMT) in 2030.

Figure 8. Difference in Vehicle-Miles Traveled (VMT) per Acre between the BAU and the PFA scenario  (Source: Authors).

Figure 8. Difference in Vehicle-Miles Traveled (VMT) per Acre between the BAU and the PFA scenario  (Source: Authors).