
Figures & data
Figure 1. Three core elements of the SP adapted from (Porter & Heppelmann, Citation2015).
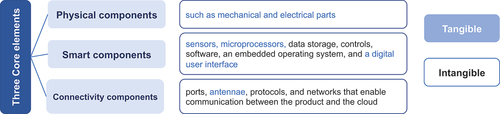
Figure 2. The dimensions of fidelity adapted from (McCurdy et al., Citation2006) and (Fiorineschi & Rotini, Citation2019).
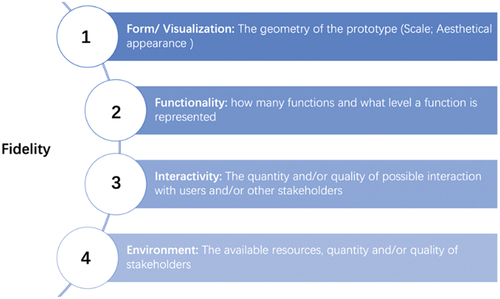
Table 1. Typical prototyping tool characteristics with respect to the characteristics of SPs.
Figure 3. The flow diagram of survey 1.
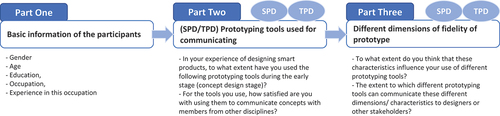
Figure 4. Occupation distribution in Survey 1.
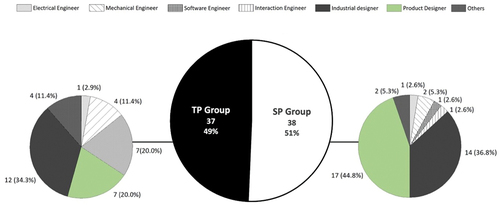
Table 2. Prototyping tools used for communicating concepts with members from other disciplines.
Figure 5. Four-quadrant chart.
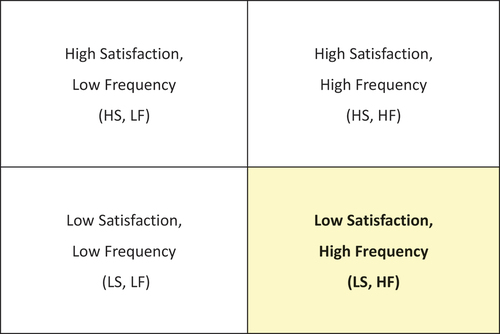
Figure 6. Four groups of four-quadrant chart.
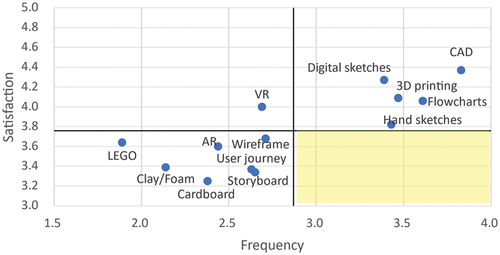
Figure 7. Tree diagram for the thirteen tools (two variables: frequency and satisfaction).
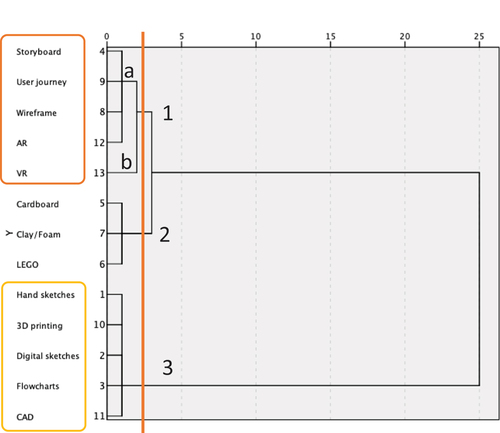
Figure 8. The average of tool dimensions (To what extent that these dimensions of fidelity influence your use of different prototyping tools).
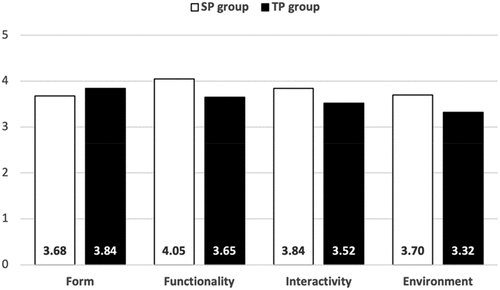
Figure 9. Tree diagram for these 13 tools (4 variables: frequency, satisfaction, interactivity, environment).
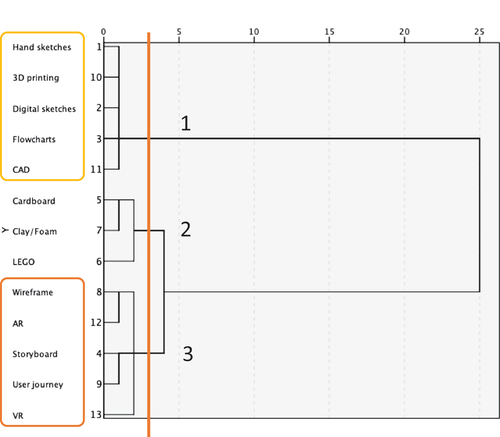
Table 3. The elements of the user journey, wireframe and storyboard.
Figure 10. The flow diagram of survey 2.
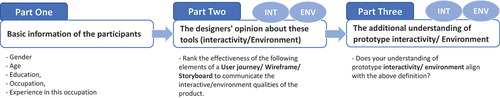
Figure 11. Frequency of using user journey, wireframe and storyboard in a different occupation.
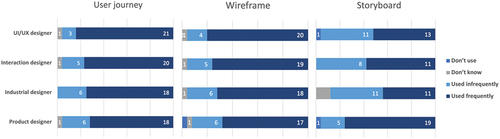
Table 4. Results of one-way ANOVA of the design discipline groups’ preference for user journeys.
Table 5. Results of one-way ANOVA of the design discipline groups’ preference for wireframes.
Table 6. Results of one-way ANOVA of the design discipline groups’ preference for storyboards.
Table 7. Result for four design discipline groups’ preference for storyboards, significant differences in bold.
Figure 12. Elements of prototyping tools ranked by UI/UX designers according to their importance in communicating the interactivity (green) and environment (yellow) qualities of a design.
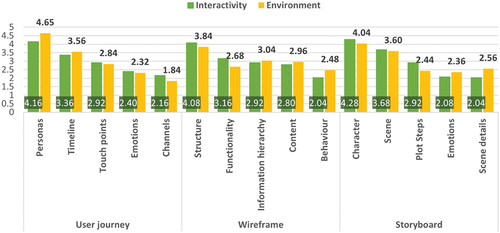
Figure 13. Elements of prototyping tools ranked by interaction designers according to their importance in communicating the interactivity (green) and environment (yellow) qualities of a design.
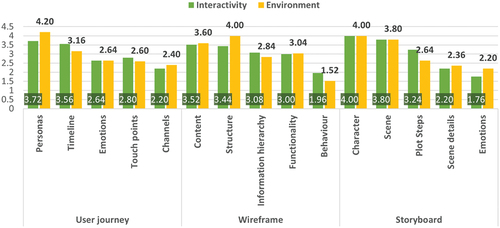
Figure 14. Elements of prototyping tools ranked by industrial designers according to their importance in communicating the interactivity (green) and environment (yellow) qualities of a design.
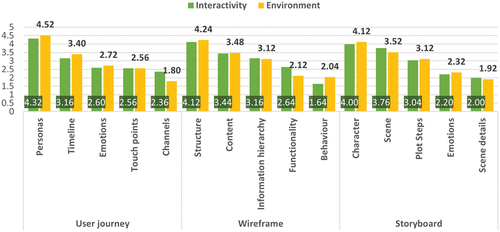
Figure 15. Elements of prototyping tools ranked by product designers according to their importance in communicating the interactivity (green) and environment (yellow) qualities of a design.
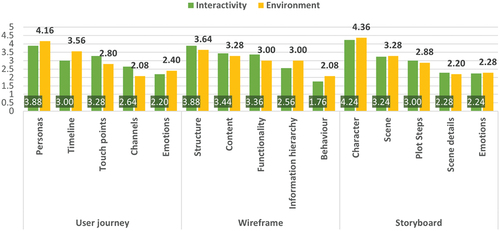
Table 8. The summary of key elements (ranking) in these tools.
Table 9. Coding scheme.
Table 10. The values represent the number of designers citing each code (interactive qualities).
Table 11. The value represents the number of designers citing each code (Environmental qualities).