Figures & data
Figure 1. X-ray diffractogram of (a) GGBS; (b) FA; (c) GP.
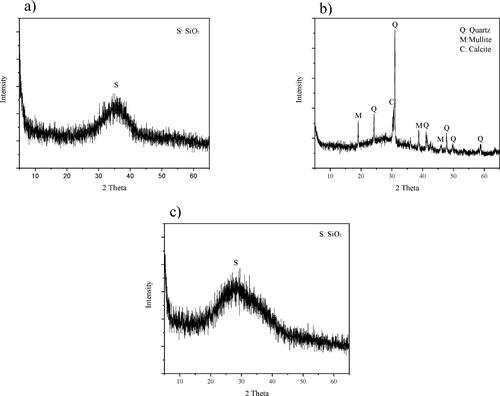
Table 1. Chemical composition and physical properties of waste glass, GGBS, and Fly ash.
Figure 2. The particle size distribution of GGBS, FA, and GP.
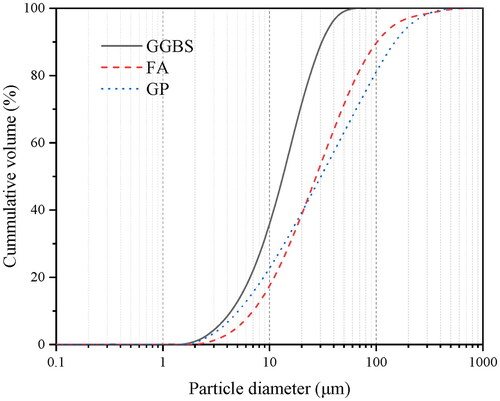
Table 2. Formulations of the mortar samples.
Table 3. The elemental molar ratio of samples (without activator).
Figure 3. Accelerated chloride penetration test: (a) AAM samples; (b) Immersed setup.
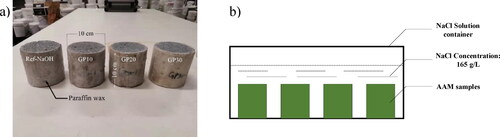
Figure 4. (a) Normalized heat evolutions of paste mixtures; (b) Normalized peak height and time to reach the reaction peak.
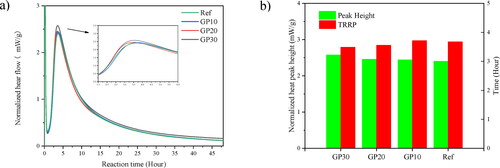
Figure 5. XRD pattern of GGBS/FA paste mixtures with different GP replacement at 28 days.
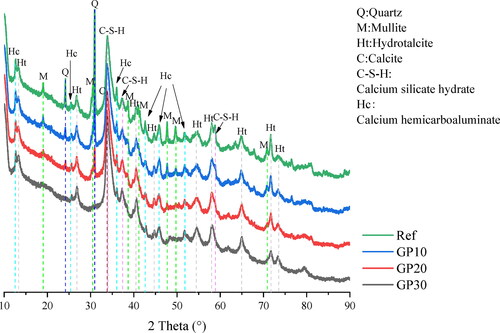
Figure 6. (a) Thermogravimetry (TG) curves of paste mixtures at 28 days; (b) Differential thermogravimetry (DTG) curves of paste mixtures at 28 days.
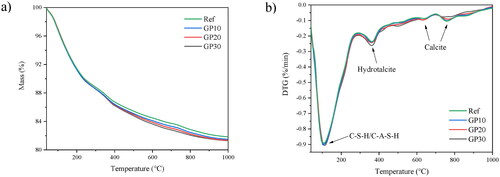
Figure 7. (a) The pore size distribution of AAM pastes; (b) Cumulative pore volume of AAM pastes.
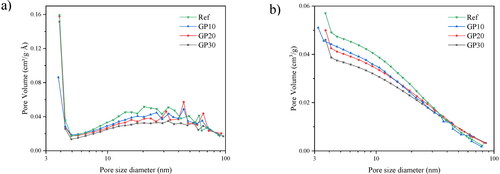
Table 4. Chloride leaching results of AAM mortars in different depths to exposure surface (unit: mg/mL).
Figure 8. Chloride penetration of AAMs mortars (a) Ref; (b) GP10; (c) GP20; (d) GP30.
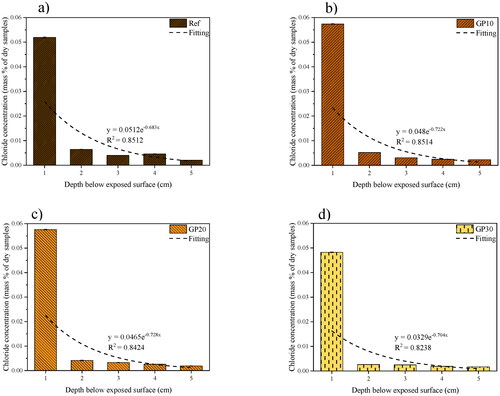
Table 5. Apparent chloride diffusion coefficients of AAMs mortars.
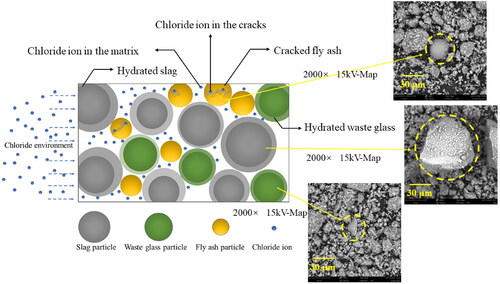
Figure 9. Chloride transport in AAM mortars.